It’s still good to be rich.
By Dwyer Gunn
(Photo: Jonathan Schrock/Flickr)
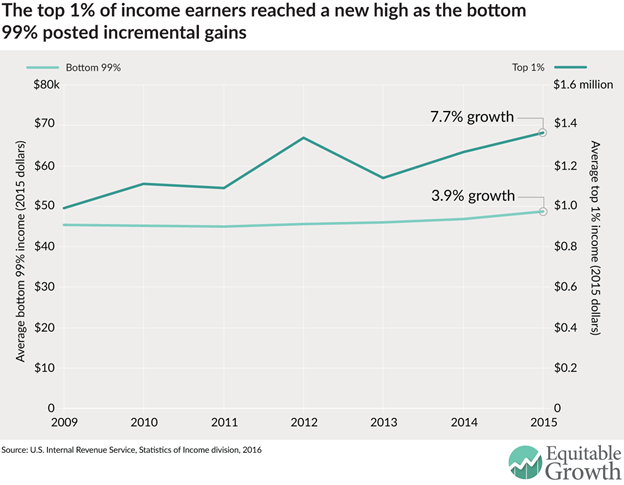
On Tuesday, Emmanuel Saez, director of the Center for Equitable Growth and noted inequality expert, released an update on the state of inequality and income in America, based on new data from the Internal Revenue Service. First, the good news: 2015 was a good year for everyone. Incomes for the bottom 99 percent of Americans grew by 3.9 percent in 2015, which was the best real income growth that demographic has seen in 17 years.
Now, the bad news: The top 1 percent continues to outpace everyone else. Incomes for that demographic grew by 7.7 percent. This chart, from Saez’s report, illustrates recent trends:

(Chart: Center for Equitable Growth)
Despite income growth in 2014 and 2015, Saez notes, most American families have yet to reach pre-Recession income levels — they’ve still only recovered 60 percent of their income losses. Just as troubling, however, are the ongoing disproportionate income gains enjoyed by the top 1 percent.
“[T]he top 1 percent of families captured 52 percent of total real income growth per family from 2009 to 2015 while the bottom 99 percent of families got only 48 percent of total real income growth,” Saez wrote. “This uneven recovery is unfortunately on par with a long-term widening of inequality since 1980, when the top 1 percent of families began to capture a disproportionate share of economic growth.”
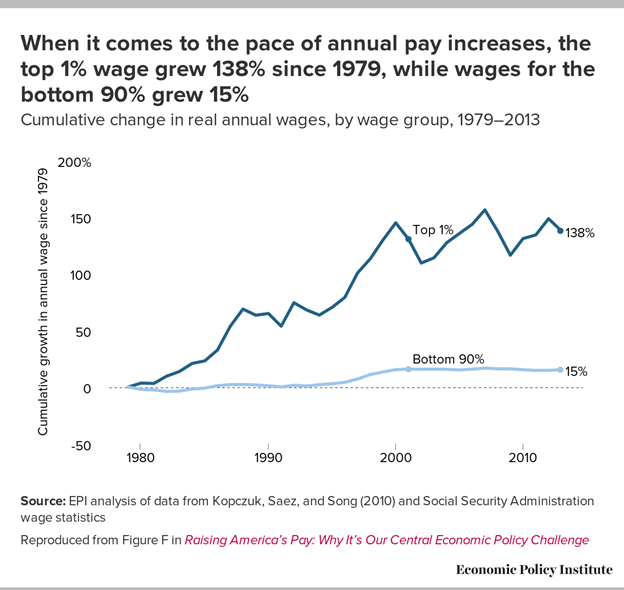
The inequality trend, as Saez notes, is long-standing and began in 1980, as this chart from the Economic Policy Institute, a liberal think tank, illustrates:

(Chart: Economic Policy Institute)
There’s a clear need for reform; the question is what shape that reform will take.
In late June, House Republicans, led by Speaker Paul Ryan, released their plan for tax reform. The final plank of Ryan’s “A Better Way,” alternative-to-Trump policy agenda, the tax reform plancalls for a simplification of the tax code (Republicans boast that most people would be able to file their taxes on a postcard-sized form), significant tax cuts for both corporations and individuals, the elimination of most itemized deductions and tax breaks, and a shift toward a consumption-based tax.
Since the release of Ryan’s plan, several think tanks have evaluated the costs of the proposed changes. The Tax Foundation, which is pro-business and leans conservative, evaluated the plan on both a static and a dynamic basis — the latter incorporates the positive economic effects of the plan into final cost estimates. According to the Tax Foundation’s analysis, the Republican plan would reduce federal tax revenue on a static basis by $2.4 trillion over the next decade, but would substantially increase gross domestic product (GDP) and broaden the tax base, leading to an ultimate cost of only $191 billion (on a dynamic basis). The Tax Foundation predicts that the plan would increase long-run GDP by 9.1 percent and wages by 7.7 percent and produce an additional 1.7 million full-time equivalent jobs.
Meanwhile, the liberal Center for Tax Justice puts the static costs of the Republican plan much higher — at $4 trillion. The Center for Tax Justice’s analysis doesn’t address the plan’s potential positive effects on GDP and economic growth, but some liberals have expressed skepticism over the Tax Foundation’s rather optimistic assumptions about the positive economic effects of the Republican tax plan.
Paul Ryan’s tax plan would generate much larger benefits for wealthier Americans.
Interestingly, both organizations agree on one thing: Ryan’s tax plan would generate much larger benefits for wealthier Americans.
The Tax Foundation concludes that, on a static basis, the Republican plan would increase after-tax incomes by a small amount (less than 1 percent) for those in the bottom 80 percent, by 1 percent for those in the top 10 percent, and by 5.3 percent for those in the top 1 percent. On a dynamic basis, the Republican plan would increase incomes for all taxpayers by at least 8.4 percent, and increase incomes for the top 1 percent by 13 percent.
The Center for Tax Justice, meanwhile, estimates that the wealthiest 1 percent of Americans would take home the majority (60 percent) of the individual tax cuts proposed in the plan, with the top 0.1 percent of American earners getting especially lucky.
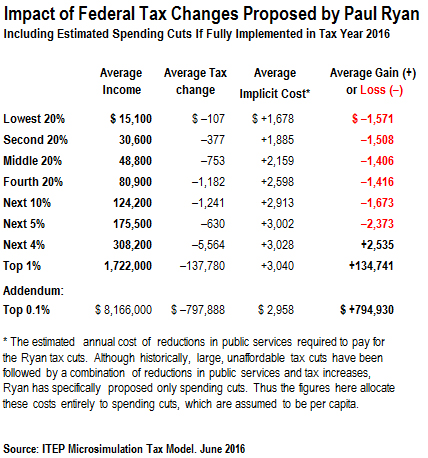
“[T]he middle 20 percent of Americans would receive tax cuts averaging $753 a year under the proposal (equal to 1.5 percent of income) and the poorest 20 percent would see average tax cuts of $107 a year (0.7 percent of income) compared to the top 1 percent whose average tax cut would be 8 percent of income under Ryan’s proposal,” the Center for Tax Justice writes.
The Republican tax plan doesn’t discuss the specific cuts to government spending that would likely need to occur alongside the proposals, but the Center for Tax Justice takes its analysis one step further by simulating the effects of a package of hypothetical spending cuts. Once these cuts are incorporated, the Center for Tax Justice estimates that only the top 5 percent of Americans would ultimately benefit under the plan.

(Chart: Center for Tax Justice)
The figure at left, from the Center for Tax Justice, shows this breakdown, by income bracket.
Income inequality has become the defining economic issue of our time. Politicians across the spectrum, prodded by their increasingly angry constituencies, agree that it has reached untenable levels. While liberals contend that the wealthiest Americans are engaged in a massive “rent grab” — essentially taking money away from everyone else and causing the stagnating wages faced by middle- and lower-income Americans—conservatives argue that the nature of the American workplace has simply changed in a way that rewards a smaller subset of the population.
Regardless of your opinion on the 1 percent, it’s difficult to imagine this is an appropriate time to re-make our tax code (and, presumably, government programs) in a way that benefits the wealthiest Americans more than anyone else.

||


