Wealth data is not easy to get. Still, for three years now, Credit Suisse Research Institute has published an annual Global Wealth Databook, which attempts to estimate global wealth holdings. The most recent issue includes data covering 2012. According to Credit Suisse, the goal “is to provide the best available estimates of the wealth holdings of households around the world for the period since the year 2000.”
According to the publication, global household wealth was $222.7 trillion in mid-2012, equal to $48,500 for each of the 4.6 billion adults in the world. Wealth is defined as “the marketable value of financial assets plus non-financial assets (principally housing and land) less debts.”
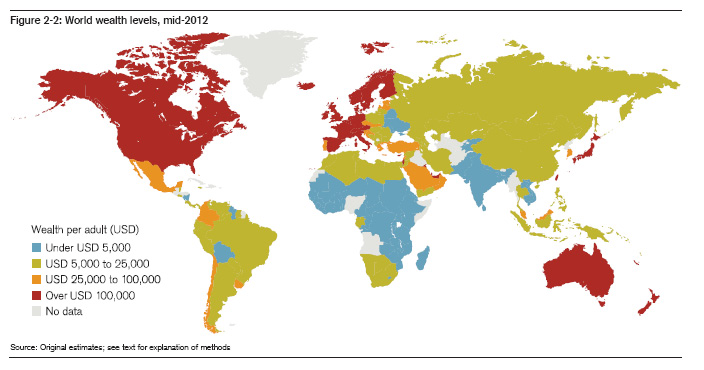
Not surprisingly, as the figure below shows, average global wealth varies considerably across countries and regions.

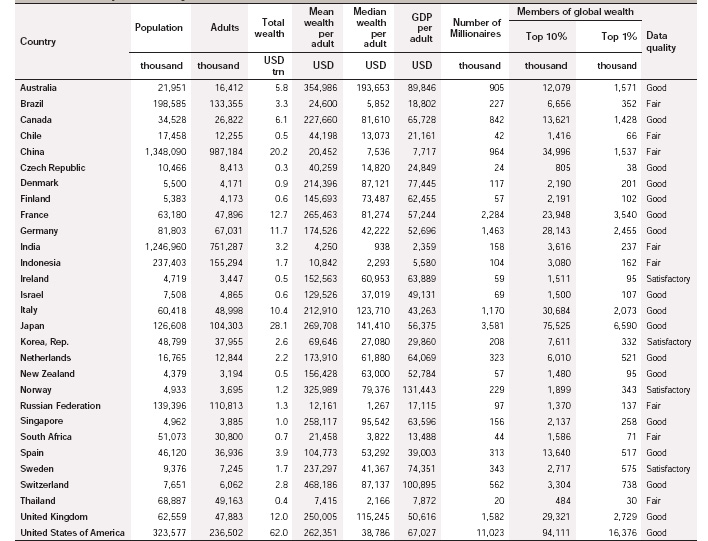
Also significant are the values of the mean vs. the median wealth in each of the countries. Mean or average wealth is calculated by dividing the total wealth of a country by its adult population. Median wealth is the wealth holdings of the adult in the middle of the wealth distribution. The median is generally considered a far more reliable indicator of wealth because it is less sensitive to extremes at the top or bottom of the distribution. The greater the divergence of mean and median wealth, the greater is the wealth inequality.
The table below provides mean and median wealth estimates for those countries with generally reliable data. As you can see, the U.S. ranks high in terms of mean wealth, trailing only five countries. Things are quite different when it comes to median wealth; the U.S. trails 26 countries! Not surprisingly, then, the U.S. is number one when it comes to the mean/median wealth ratio, or wealth inequality.

We clearly dominate in the number of millionaires and the upper global wealth categories. Are we a wealthy country? Definitely. Is that wealth concentrated in relatively few hands? Definitely.
This post originally appeared onSociological Images, a Pacific Standard partner site.


