On Thursday, the Bureau of Labor Statistics released the 2017 Contingent and Alternative Employment Arrangements Survey, which tracks alternative work arrangements in the United States. Despite quite a bit of handwringing in recent years about the rise of the “gig economy“—that is, jobs that are characterized by instability and a lack of benefits—the percentage of American workers employed in most types of alternative arrangements has actually declined since 2005 (the last time this measure was reported), according to the report.
In 2005, the percentage of American workers employed in contingent (i.e., non-permanent) work arrangements was 4.1 percent. In 2017, it dropped to 3.8 percent. Not surprisingly, contingent workers were disproportionately young, less likely to have a high school education, and more likely to work part-time. The percentage of workers employed as independent contractors, meanwhile, declined from 7.4 percent in 2005 to 6.9 percent in 2017.
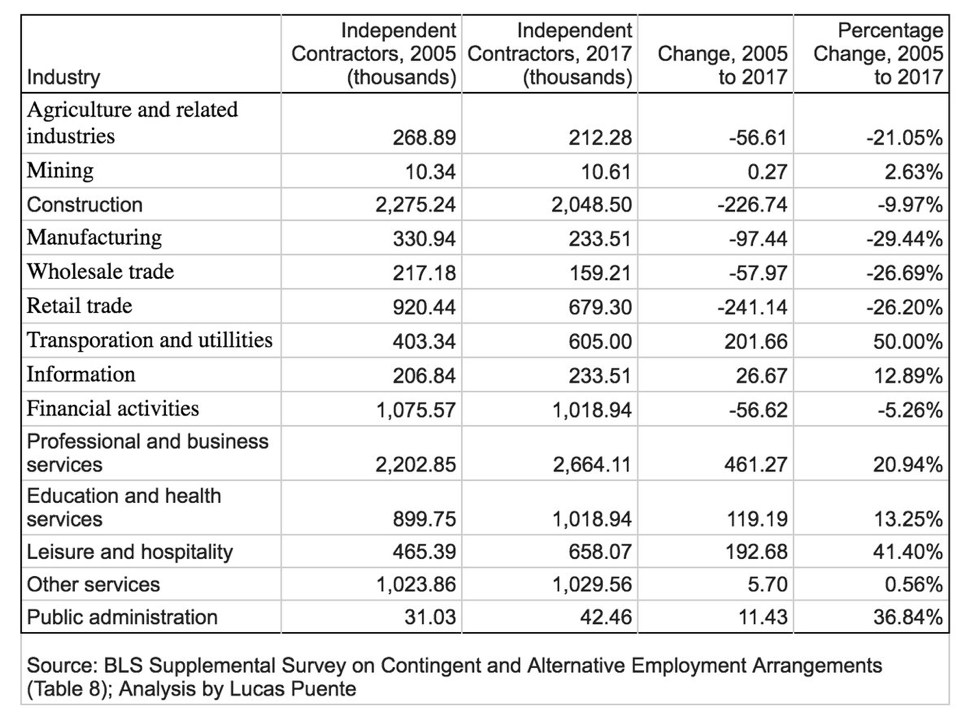
The results of the survey actually run counter to a growing body of recent research that’s found evidence suggesting an uptick in the percentage of Americans employed in these types of alternative arrangements. It’s no surprise, then, that economists and researchers have offered various caveats to the data released today. On Twitter, Lucas Puente of Thumbtack, the professional services network, points out that “[t]oday’s headline finding that ‘alternative’ arrangements are a smaller share of the workforce in 2017 than they were in 2005 masks important industry-level patterns. Independent contractors are becoming more common in fields that are growing and less common in those that aren’t.”
The chart below, from Puente, illustrates varying trends among independent contractors across industries:

Other researchers, meanwhile, have pointed out that this BLS data tracks only primary work positions; a full-time teacher who drives for Lyft or Uber on the side, for example, would not be counted as a contingent worker in the data.
It seems the BLS data only tells half the story.


