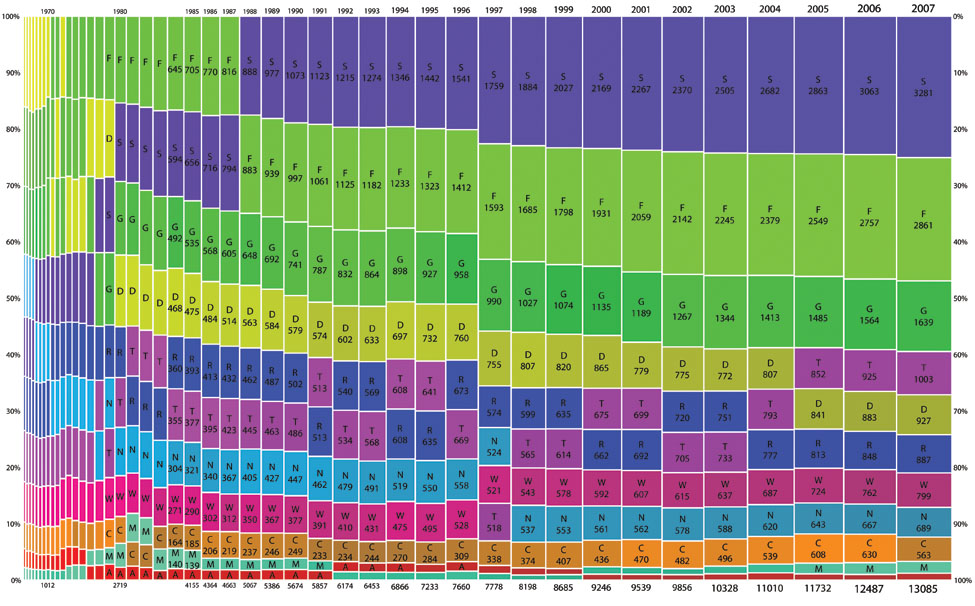
This spinogram depicts U.S. gross domestic product, divided into constituent sources. Column widths are proportional to a year’s real GDP, and each sector’s contribution to GDP is reflected in box height. Color intensity varies with historical relative magnitude of a sector’s contribution to GDP. Clearly shown is the service sector’s 25-year rise to dominance, paralleling a drop in the importance of manufacturing and increasing transportation production in periods of high energy prices. Numbers in billions of dollars.
Key to abbreviations:
• Agriculture, forestry and fishing
• Construction
• Durable goods manufacturing
• Finance, insurance and real estate
• Government
• Mining
• Nondurable goods manufacturing
• Retail trade services
• Service
• Transportation and public utilities
•Wholesale trade