Mid-life crises are great for an excuse to drop a pile of money on some luxury good you’ve never been able to afford before. But instead of, say, a 2014 Bentley V8 S convertible, why not try a kid? The average cost of raising a child in the United States is now $245,340, according to data collected over the course of 2013 by the U.S. Department of Agriculture.
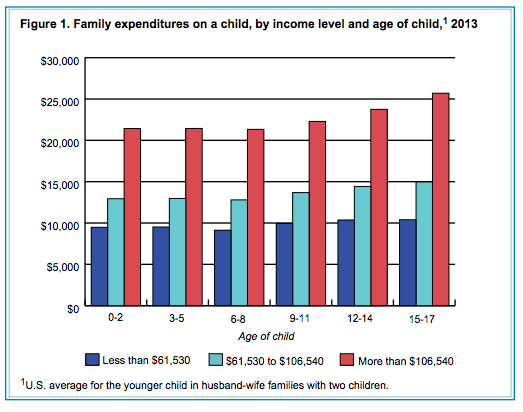
A household earning above $106,540 was able to spend more than double the amount spent by those earning less than $61,530, particularly for young children.
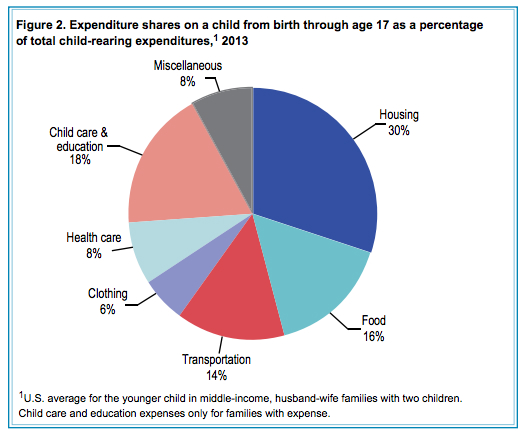
That’s the price of bringing a child from birth (no pregnancy expenses here) to age 18, when they become a legal adult. It’s around five times the annual median income in the country of $51,371, and similar to buying a house in the Northeast, the second most expensive region in the country after the West. In order of magnitude, the costs are broken down into categories of housing (30 percent), child care and education (18 percent), food (16 percent), transportation (14 percent), health care (eight percent), clothing (six percent), and everything else in the catch-all of “miscellaneous” (eight percent).
The initial price tag may induce sticker shock, but embedded in the research are important lessons about the investments we make in our children, particularly across income levels. Does how much money you make impact what you prioritize as your kids grow up?
1. High-Income Families Spend Over Twice as Much as Low-Income Families on Their Children
Structural inequality is growing in the U.S., a fact acknowledged across the political spectrum. But few statistics illustrate that fact as starkly as a graph of how much the highest-income families can spend on their children versus the lowest-income families in a single year. A household earning above $106,540 was able to spend more than double the amount spent by those earning less than $61,530, particularly for young children. When the kids become teenagers, the spending of high-income families also grows faster than the other groups, reaching $25,000, as compared to $15,000 in the middle range and around $10,000 at the bottom.

Yet even that increased spending is less of a burden on wealthier families, who spend the lowest percentage of their income on their children (as measured before taxes). The lowest-income group spent 25 percent of their income on a child, while the middle-income group spent 16 percent and the top bracket just 12.
This discrepancy feeds into the education gap that follows income inequality. Twenty-three percent of child-rearing costs for the highest-income families goes toward child care and education, while low-income households can only devote 14 percent. Given that early-life child care has a positive and lasting effect on a child, the structural problem is already clear.
2. Single Parents Spend Less on Their Children, But Not Much Less
Zooming in closer to the low-income bracket, a more positive trend emerges, at least as far as investment in a child’s well-being. As U.S. News and World Reportnotes, “more than 60 percent of all children living in poverty are in households headed by a single parent.” However, the USDA report shows that single-parent households spend nearly as much on a child as two-parent households, at $164,160 versus $176,550, a gap of just seven percent. But that investment comes at a greater cost proportional to income—within the lowest-income range, single-parent families fell closer to the bottom.
3. Housing Is a Universally High Expense
In contrast to areas like education, families spend similar proportions of their income on housing, regardless of their income level—32 percent for high, 30 percent for middle, and 33 percent for low. In fact, housing costs have remained remarkably consistent over time. In 1960, housing still accounted for 31 percent of the cost of raising a child. The statistic is measured by the expense of an additional bedroom, furnishings, and utilities as the child ages.

Though the percentage is even, of course, the final investment is not. As the report points out, the statistic “does not account fully for the fact that some families pay more for housing to live in a community with good schools or other amenities for children.” In other words, the cost of housing can also have a direct impact on opportunities in other categories.
4. Cost Depends on Region
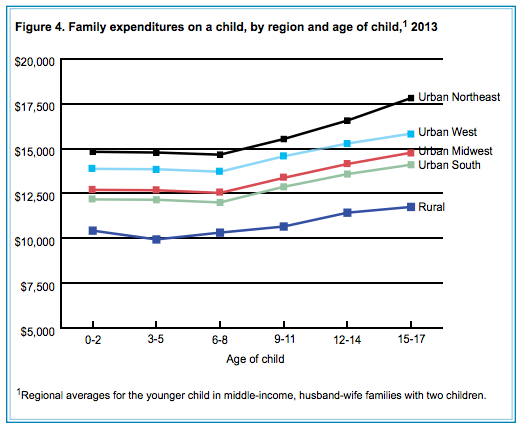
Looking to make a move to start a family? Try outside of the urban Northeast, the most expensive place to have a child. Expenditures are much higher overall in that region, and they also rise faster as children get older, hitting around $3,000 more than the next highest region, the urban West, when kids are over 15. The urban South is slightly less expensive than the urban Midwest, but the cheapest overall choice is any rural area, largely because of low housing costs. Cities, however, might provide more overall support for child-raising as well as advancement opportunities.

5. Plan Carefully
The cost of raising a child generally increases with each year as they age, as this useful infographic from CNN shows. But the USDA’s report doesn’t include any data on paying for a college education, which could add hundreds of thousands of dollars to the expense of raising a child. This also makes for a point of departure between rich and poor families—the biggest investment in education is likely to happen after age 17, not before. And with an average cost of $3,131 per year for community colleges to $29,056 for private four-year universities, that could add on a large part of the overall cost.
The major lesson to be taken from the USDA report overall is that while the cost of having a child might be predictable, how that level of investment impacts the child’s well-being is not as clear. You can spend $245,340—but unlike that Bentley, you never really know what you’re going to get out of it.


