For a company intent on going global, one of the most difficult problems in determining the market potential for Westernized goods and services is knowing the number of potential buyers in any specific country. Population numbers are easy to get, but, for most countries, those numbers can be misleading. Buyers of Westernized goods are likely to be in the middle class or above, but — until now — there has been no reliable measure of the size of the middle-class market in various countries.
It is easy to get gross domestic product data for most countries, but when one divides by the number of people to yield the “average” GDP per person, the result often is meaningless, in terms of potential sales. Many countries in the world have a bimodal wealth distribution; there are a small number of enormously rich people and a huge number of very poor, with very few in the middle. In those cases, the statistical “average GDP per person” may represent almost no one.
On a biannual basis since 2002, I’ve compiled a rather complex recipe of statistics about countries around the world for use in the international marketing class I teach at Pepperdine University. Students use the size-of-market numbers when they design product-entry strategies for various countries. The ingredients in the recipe are GDP, literacy rate, urbanization, rate of unemployment, reported poverty rate and several other factors. The data are gathered from several sources, including the United Nations Statistics Division’s Statistical Yearbook; the U.N. Educational, Scientific and Cultural Organization; the International Monetary Fund; the U.S. Central Intelligence Agency’s World Factbook; The World Almanac and Book of Facts; and publications originating in specific countries.
Each nation’s population is then broken into quintiles and then deciles to yield an estimated percent of people with a disposable income that is roughly equal to Western middle-class levels. “Middle class” is a somewhat subjective term because purely objective numbers like dollar-equivalent income of purchasing-power parities are often misleading. Such factors as bartering traditions, multigenerational family living, family division of labor and climate affect the amount of income needed to be considered middle class. For global marketers, perhaps the most useful definition of middle class is “a person who could routinely buy items sold at a typical Western-type discount store.”
These percentages are multiplied by the total population to yield an estimate of the number of people in the middle class for each country. I have also sorted these national estimates in a number of ways: by the absolute size of the middle class, by the middle class’s growth rate over time, by the size of the middle class relative to that of other countries’ middle classes over time, and by projected middle-class populations in the future.
Six of the most interesting facts emerging from this year’s analysis:
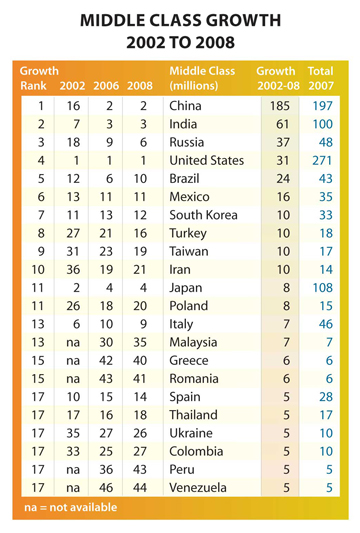
1. China has increased its middle class by 185 million people in the past six years. That increase is equivalent to the entire middle-class increase for India, Russia, the U.S. and all of Europe — combined! In fact, each time China adds 1 percent to its middle class, it adds the equivalent of the entire population of Greece or Sweden. (See “Adler’s List of Attractive Markets – 2008.”)
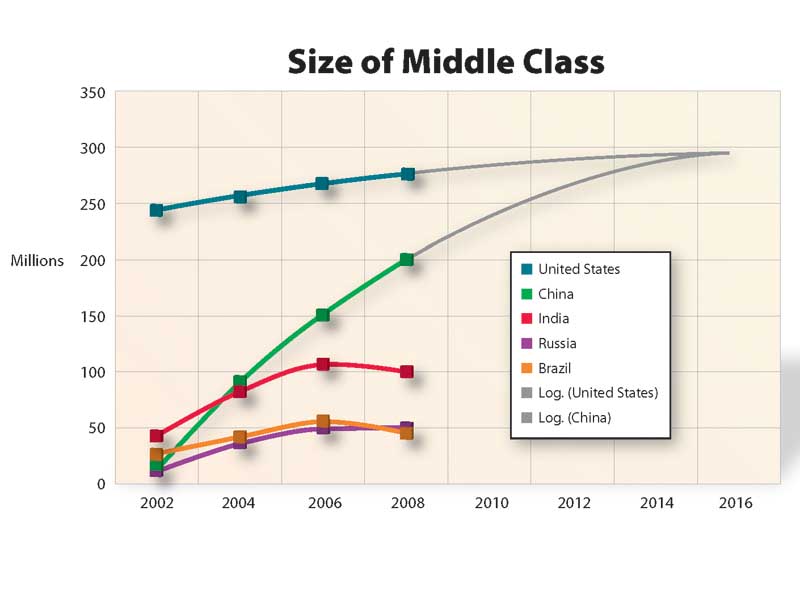
2. The U.S. has been the leader in terms of the size of its middle class for decades, but China will pass the United States in terms of middle-class population in 2016. The top five middle-class nations will then be China, the U.S., India, Japan and Germany. (See “Size of the Middle Class.”)
3. From 2016 on, the undisputed middle-class leader will be China. By 2025, the United States will have about 319 million people, or about 91 percent of the country’s population, in the middle class. China will have about 392 million in the middle class, which is only about one-quarter of its population. If the middle-class percentage for China were to climb to 44 percent, it would be double the middle-class population of the United States and be higher than the three countries nearest it in middle-class numbers (the U.S., India and Japan) combined. (See “Middle Class Size Projections to 2025.”)
4. The total population of India will equal China’s by 2025, but the middle-class percentage will remain small, largely because of the remnants of a caste system and a low level of female literacy. In contrast, China is championing free enterprise and upward mobility and has near-universal literacy — all key components in the creation of a middle class.
5. All the traditional Western democracies will continue to slide down the ranked list, as the high middle-class percentages of their small populations are overwhelmed by small (yet rapidly growing) middle-class percentages of huge populations from Asia and South America. By the year 2025, Brazil will have bumped Germany out of the middle-class top five. (See “Size of the Middle Class.”)
6. Some surprising nations will be elevated into the rest of the top 20 by 2025, ahead of the majority of traditional Western economies. Those nations include Russia, Mexico, Indonesia, South Korea, Turkey, Argentina, Pakistan and Thailand.
I developed my “List of Attractive Markets” to teach students some of the basic components of marketing in a globalized economy, but it should be required reading for any U.S. or EU business executive engaged in international trade. Wise Western executives and companies will thrive in the global economy by identifying which populations can purchase Western-type goods and services and making plans to serve those people. Putting marketing plans into action takes time, and, in an international setting, the actual time required is often much longer than initially projected. It is not unusual for a company to have a planning horizon of five to 10 years from the start of the process to full-scale implementation in an international setting. So even for businesses involved only in the domestic market, now may be the time to start identifying promising international targets for their products.
For most economic trends, prediction is difficult over a multiyear time horizon. Population projections by nation are remarkably accurate, however, because normal family size is known, the birthrate is known, the death rate is known and today’s toddlers will be giving birth to a known number of children 30 years from now. Those children will repeat the cycle 30 years later. When those numbers are combined with indications of middle-class prosperity that also tend to have predictable trends, the result is a list of attractive global markets that seems to be more accurate than many other measures of buying power commonly used by companies entering the international economy.


Sign up for our free e-newsletter.
Are you on Facebook? Click here to become our fan.


