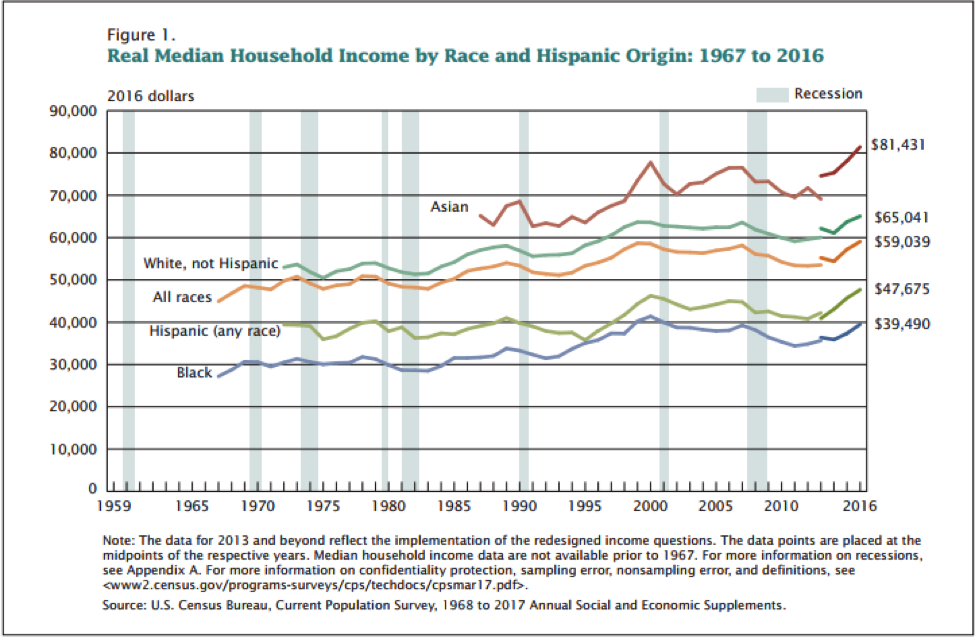
The United States Census Bureau released on Tuesday its annual report on poverty, income, inequality, and health-insurance coverage in America. As with last year’s report, which found that median household income in 2015 in the U.S. increased for the first time since 2007, these latest numbers indicate that the economy is continuing to recover from the Great Recession. In 2016, median household income increased by 3.2 percent, to $59,039. These gains were driven by an increase in the number of full-time workers in the economy, rather than higher earnings for full-time workers, which were statistically unchanged from 2015.
Because of a change in the way the Census Bureau calculates household income in 2013, it’s difficult to make direct comparisons between pre- and post-Recession household income levels as reported by the bureau. However, the Economic Policy Institute, a progressive think tank, calculates that median household income in 2016 is still 1.6 percent less than it was in 2007, and 2.3 percent less than it was in 2000.
The number of Americans living in poverty also decreased in 2016. There were 40.6 million people living in poverty last year, 2.5 million fewer than in 2015. At 12.7 percent, the U.S. poverty rate is finally, according to Census Bureau researchers, not statistically different from the 12.5 percent rate observed in 2007, the year before the Great Recession.
As with last year, the gains were broad-based, with respect to race. The chart below, from the report, breaks down income gains by race:

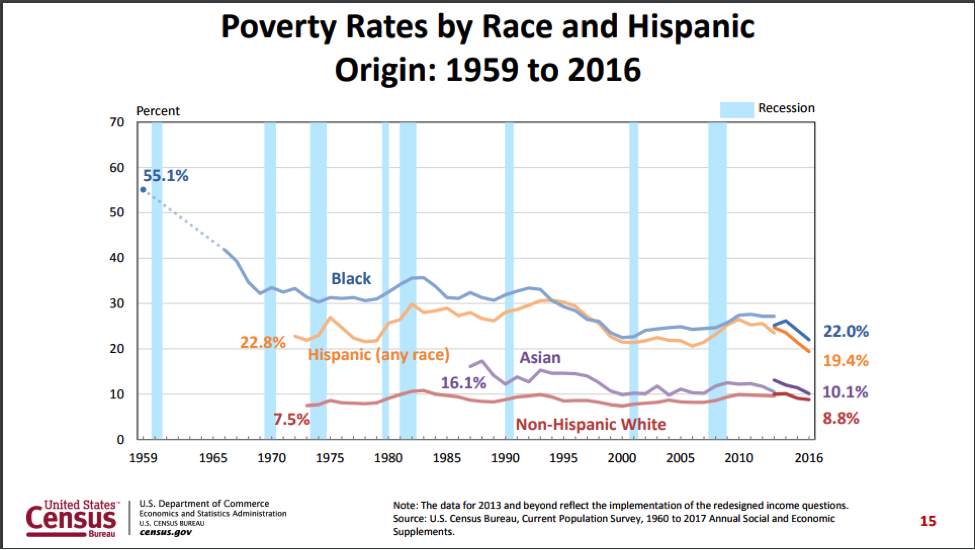
Between 2015 and 2016, median incomes increased by 2 percent for white households, 5.7 percent for black households, and 4.3 percent for Hispanic households. Gains aside, substantial income gaps persist. Median household income for black households was only $39,490 in 2016, while median household incomes for white households was $65,041. Likewise, while the poverty rate for black Americans declined to 22 percent in 2016 (from 24.1 percent in 2015), it’s still much higher than the poverty rate for white Americans of 8.8 percent. The chart below, from a presentation accompanying the report’s release, illustrates poverty rates by race:

Especially in light of last year’s gains, this data suggests not just that the economy is mending, but that economic gains are finally reaching middle-class households, as opposed to only top earners. “The typical household’s income rose more from 2014 to 2016 than in any other two-year period on record (with data back to the 1960s), poverty declined, and the share of Americans without health insurance fell to a record low,” wrote Robert Greenstein, the president of the Center on Budget and Policy Priorities, a liberal think tank. “This marks the first time on record, with data back to 1988, that all three measures of well-being improved for two years in a row.”
Several components of this year’s Census Bureau report are also particularly relevant in light of the ongoing debate over repealing and replacing the Affordable Care Act and the Trump administration’s budget, which called for deep cuts to the social safety net. In 2016, the percentage of Americans with health-insurance coverage was 91.2 percent (a slight increase over the 2015 rate), which is the highest rate ever recorded. Uninsured rates are, not surprisingly, lower in states that expanded Medicaid, as the figure below illustrates:

Since 2011, alongside its report on income and poverty, the Census Bureau also releases a report on something called the Supplemental Poverty Measure, which, in the words of the bureau, “extends the official poverty measure by taking account of many of the government programs designed to assist low income families and individuals that are not included in the official poverty measure.” The figure below, from the supplemental report, illustrates how social safety net programs, as well as various taxes and other expenses, affects the number of people living in poverty under the SPM:

The Social Security program alone prevents 26.1 million people from living in poverty. Refundable tax credits (such as the Earned Income Tax Credit) and the food stamp program, meanwhile, keep 8.2 and 3.6 million people, respectively, out of poverty. (On the other side of the ledger, medical expenses drove approximately 10.5 million families into poverty in 2016.)
This data confirms that the recovery that started under President Barack Obama continues: Finally, the American economy is mending. The millions of Americans who rely on the social safety net, however, are likely still watching Washington nervously.


