Last week, the Brookings Institution released a report on inequality in America’s cities and metropolitan areas. Authored by Alan Berube and Natalie Holmes, the report compares the incomes of earners in the 95th percentile to those in the 20th percentile, and constructs a “95/20 ratio” for the United States’ 100 largest metro areas, and for each metro area’s largest city.
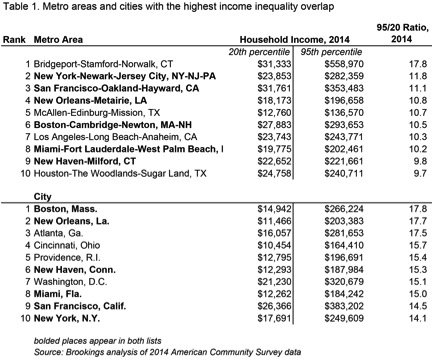
Among the report’s main findings: There is still substantial variation in inequality levels across the country. While the usual suspects like the New York and San Francisco metro regions again rank near the top of the list, it’s actually Connecticut’s Bridgeport-Stamford-Norwalk area, which contains a number of wealthy suburbs that are a quick train ride away from New York City, that earned the dubious distinction of being the nation’s most unequal metropolitan area.
The chart below shows America’s most unequal metro areas and cities (a higher 95/20 ratio means greater inequality):

The Brookings report is particularly interesting in light of a growing body of research on the role that local and regional conditions play in long-term outcomes, particularly social and economic mobility. Much like inequality, upward mobility—the likelihood that a child born and raised in poverty will manage to escape poverty—varies quite a bit across the country.
Over the last several years, researchers at the Equality of Opportunity Project have been studying geographic variations in upward mobility across the U.S., and have reached some fascinating conclusions about the importance of location. “The U.S. is better described as a collection of societies, some of which are ‘lands of opportunity’ with high rates of mobility across generations, and others in which few children escape poverty,” wrote Raj Chetty, Nathaniel Hendren, Patrick Kline, and Emmanuel Saez in a summary of one of their 2014 papers.
Kearney and Levine’s work suggests that the ongoing focus on the earnings of the top one percent is a distraction from the inequality that really matters.
Children who grow up poor in San Jose or Salt Lake City, for example, are as likely to escape poverty as those who grow up in a socialist haven like Denmark; children raised in Atlanta or Milwaukee, by contrast, aren’t so lucky. While Chetty and his co-authors haven’t yet attempted to identify the causal determinants of social mobility in a given area, they have identified five factors that are correlated with greater upward mobility: less segregation, higher-quality schools, greater social capital, more stable family structures (which I’ve written about before), and lower levels of inequality.
It’s not great news, then, that the other major finding of the Brookings report is that falling wages for low-income workers have resulted in increased inequality in cities and metropolitan regions across the country. “[D]ouble-digit slides in 20th percentile incomes were quite common across large metro areas,” Berube and Holmes write. “High-income households earned significantly less in 2014 than in 2007 in 33 of the 100 largest metro areas, but the same was true for low-income households in fully 81 of those metro areas.”
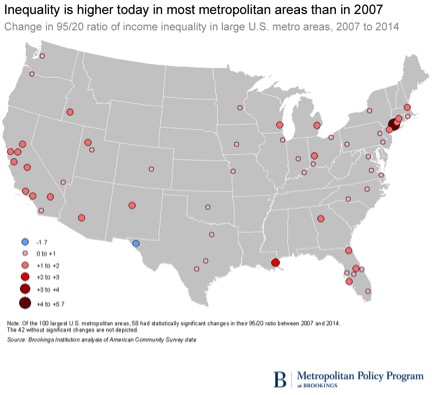
In the Bridgeport-Stamford-Norwalk metropolitan area, for example, 20th percentile incomes fell by $5,552 between 2007 and 2014, while 95th percentile incomes increased by $117,108. (For reference, 20th percentile incomes in Knoxville, Tennessee, fell by $3,122, while 95th percentile incomes increased by $11,768.)
The map below illustrates trends in income inequality between 2007 and 2014:

If the trends in income inequality highlighted by the Brookings report persist, there’s reason to be concerned that intergenerational mobility in America—which has so far remain unchanged, despite much rhetoric to the contrary—will decline. The economists Melissa Kearney and Phil Levine have explored the negative effects of high levels of inequality, which seem to extend beyond the more widely known effects of poverty. In a series of papers, they’ve found that young people in areas with persistent, entrenched high levels of inequality are both more likely to engage in early, non-marital childbearing and to drop out of high school.
“When I started looking at these outcomes, I thought it was really going to be about poverty,” Kearney says. “But we found it was more than that. Being poor is bad, but being poor in a more unequal place is worse.”
Kearney and Levine have suggested that their findings may be explained by a “culture of despair” that influences youth decision-making in areas with high inequality and low mobility. Teenagers in particularly dismal areas look around and conclude their odds of ever going to college or building a better life are low, and they simply give up.
“These kids are very cognizant of where they are in the social hierarchy, and that affects their perceptions of what their possibilities are,” Kearney says. “They don’t see anyone they know going to college, and they don’t see themselves going to college. They feel farther and farther away from middle-class life, so it just becomes a question of ‘Why bother?'”
And when it comes to inequality, both Chetty’s research and Kearney and Levine’s work suggests that the ongoing focus on the earnings of the top one percent is a distraction from the inequality that really matters.
“All of our empirical results are about the gap between the bottom and the middle,” Kearney says. “The decisions of the kids at the bottom, they’re not influenced by the top earners. It’s the gap between where they are and where the middle class is that matters.”
As it stands, low-income kids in many of the country’s metro areas are farther away from the middle class than they were in 2007, a trend that if left unchecked may jeopardize the intergenerational mobility that’s a key tenet of the American Dream.


