The great majority of Americans might find the post-recession expansion disappointing, but not the top earners.
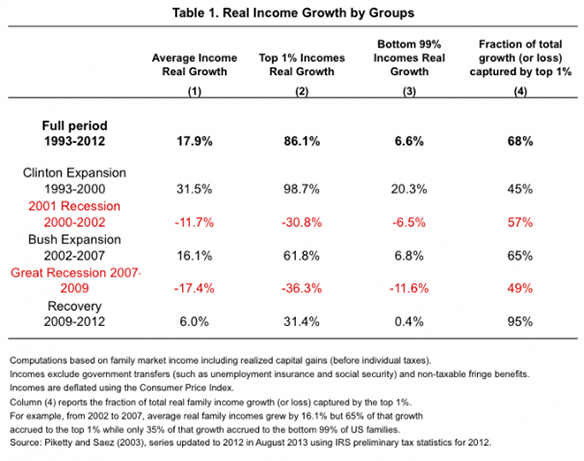
The following table reveals that our economic system is operating much differently than in the recent past. The rightmost column shows that the top one percent captured 68 percent of all the new income generated over the period 1993 to 2012, but a full 95 percent of all the real income growth during the 2009-2012 recovery from the Great Recession. In contrast, the top one percent only captured 45 percent of the income growth during the Clinton expansion and 68 percent during the Bush expansion.

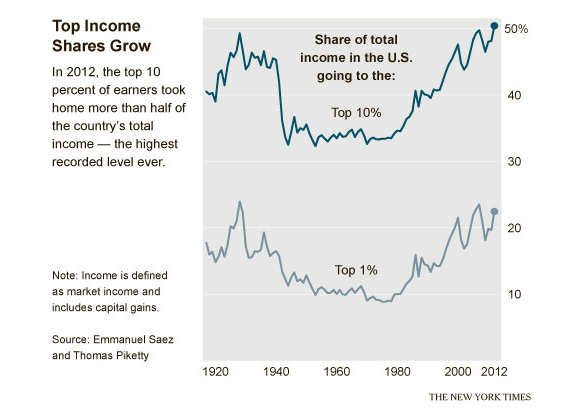
If that weren’t enough, the next chart offers another perspective on how well top income earners are doing. In the words of the New York Timesarticle that included it:
… the top 10% of earners took more than half of the country’s total income in 2012, the highest level recorded since the government began collecting the relevant data a century ago…. The top 1% took more than one-fifth of the income earned by Americans, one of the highest levels on record since 1913 when the government instituted an income tax.

We have a big economy. Slow growth isn’t such a big deal if you are in the top one percent and 22.5 percent of the total national income is yours and you can capture 95 percent of any increase. As for the rest of us….
One question rarely raised by those reporting on income trends: What policies are responsible for these trends?
This post originally appeared onSociological Images, a Pacific Standard partner site.


