These two heat maps of the globe look pretty similar, don’t they? That’s the point. Measurements of the sea surface taken earlier this month look a lot like those captured in early October 1997, when the world experienced a strong El Niño, according to NASA and the National Oceanic and Atmospheric Administration. The maps’ similarities indicate we’re in for a strong El Niño this year.
And it’s not just the sea surface: Temperatures and trade winds are also just right for an El Niño event. All that adds up, basically, to a done deal: “There is an approximately 95 percent chance that El Niño will continue through Northern Hemisphere winter 2015-16, gradually weakening through spring 2016,” the National Weather Service reported earlier this month. “The forecaster consensus unanimously favors a strong El Niño.”
The maps’ similarities indicate we’re in for a strong El Niño this year.
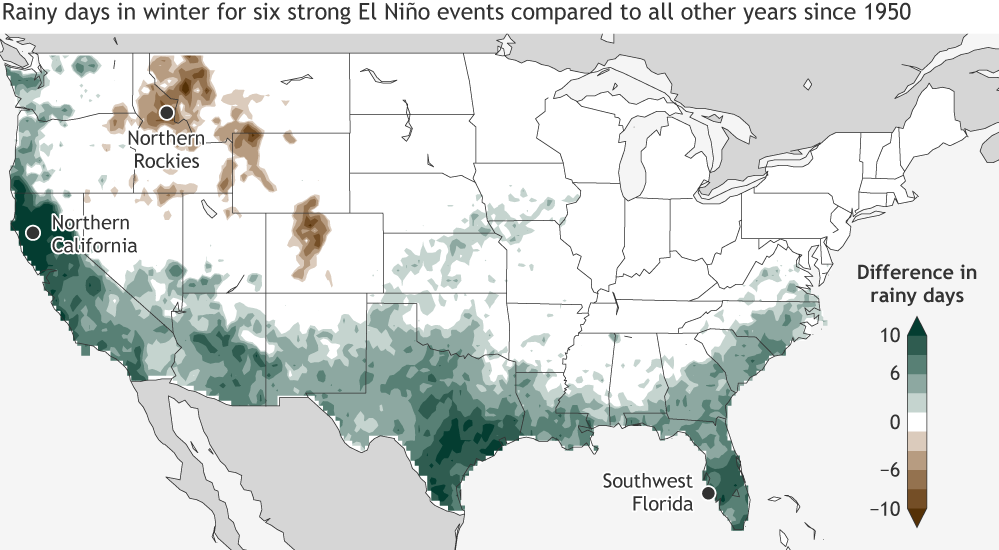
What an El Niño event means for local weather is less certain. The NWS says that the northern United States is expected to have a warmer winter with less rain and snow. Meanwhile, the southern U.S. will generally experience a cooler, wetter winter than usual. Just check out this map of the number of rainy days in previous El Niño years:

Still, “the sample of El Niños in the meteorological record are still too few and other elements of our changing climate are too new to say with certainty what the winter will bring,” according to NASA’s Earth Observatory. To reverse an old proverb, we’ve got the overall forest mapped out, but we’ll have to wait a bit longer to learn details about the trees.


