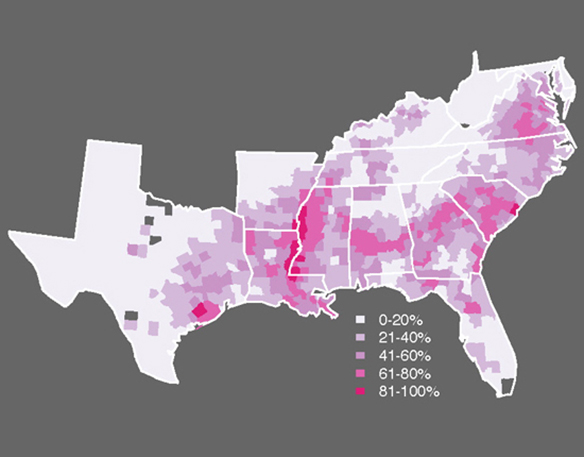
The partial U.S. map below shows the proportion of the population that was identified as enslaved in the 1860 census. County by county, it reveals where the economy was most dominated by slavery.

A new paper by Avidit Acharya, Matthew Blackwell, and Maya Sen has discovered that the proportion of enslaved residents in 1860—153 years ago—predicts race-related beliefs today. As the percent of the population in a county accounted for by the enslaved increases, there is a decreased likelihood that contemporary white residents will identify as a Democrat and support affirmative action, and an increased chance that they will express negative beliefs about black people.
Avidit and colleagues don’t stop there. They try to figure out why. They consider a range of possibilities, including contemporary demographics and the possibility of “racial threat” (the idea that high numbers of black people make whites uneasy), urban-rural differences, the destruction and disintegration caused by the Civil War, and more. Controlling for all these things, the authors conclude that the results are still partly explained by a simple phenomenon: parents teaching their children. The bias of Southern whites during slavery has been passed down intergenerationally.
This post originally appeared onSociological Images, a Pacific Standard partner site.


