One of the most closely analyzed elections from 2014 has been Colorado’s U.S. Senate race, in which first-term Democratic Senator Mark Udall narrowly lost to Republican Representative Cory Gardner. The New York Times provided a close look at this contest just last week, examining which voters turned out and which did not.
Offices can be run very differently across campaigns, and it’s not obvious that more offices means a more effective turnout effort.
Part of the reason this contest has received such scrutiny is because it was a test of the so-called Bannock Street Project, a locally focused get-out-the-vote (GOTV) effort pioneered by the Obama campaign in 2008 and refined by Michael Bennet’s Senate campaign in Colorado in 2010. (Bennet was one of very few swing-state Democratic incumbents to survive that year.) The architects of the Bannock Street Project were confident they could boost Democratic turnout again, as they had in 2010, saving Udall’s seat even though he was trailing Gardner by a few points in the polls.
Relatedly, this was also an important race because it seemed that Republican strategists had finally learned the importance of voter turnout efforts. After McCain, Romney, and Colorado Senate candidate Ken Buck had been defeated in Colorado while making few specific turnout efforts, the Gardner team devoted time, money, and office space to its GOTV campaign. How much did these efforts matter?
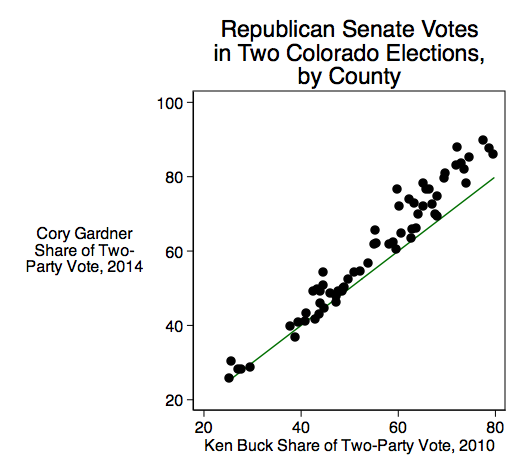
One helpful way to look at the Gardner-Udall race is to compare it to the Bennet-Buck Senate race from four years earlier. As in 2014, this was a close match in a Republican-trending year, with a Democratic incumbent fighting to maintain a recently acquired seat. Below is a scatter-plot comparing the two contests. The horizontal axis shows the Republican’s vote share in 2010; the vertical axis shows it in 2014. Each data point is a Colorado county. The green trend line shows what the 2014 vote would have been if each county had voted just as it did in 2010.

One quick takeaway from this chart is that the county-level vote shares are very similar across elections. They correlate at .977. That means that there just aren’t many county-level differences to explain. Even if Gardner put a lot of resources into, say, Adams County (a competitive county in the Denver suburbs), he only improved on Buck’s performance there by 2.4 percentage points, which is about the same as he did statewide.
Another trend to note is that many counties toward the right end of the chart are well above the line, while those to the left stick close to it. This means that the Republican vote share increased the most between 2010 and 2014 in counties that were already more conservative. This suggests a polarizing trend, with conservative counties voting more Republican and liberal counties trending more Democratic over time. It does not, however, suggest that Gardner did especially well in the swing counties where he focused most of his GOTV efforts.
The Republican vote share increased the most between 2010 and 2014 in counties that were already more conservative. This suggests a polarizing trend, with conservative counties voting more Republican and liberal counties trending more Democratic over time.
To examine the possible effects of Gardner’s and Udall’s ground campaigns, I looked at the locations of both campaigns’ field offices, which I obtained from their websites last year. I then ran a regression equation predicting Gardner’s share of the county-level vote in 2014, using Buck’s share in 2010 as a predictor. I included a variable measuring the presence of a Gardner office as another predictor variable, and another one for Udall offices. I also included a number of demographic and political county-level indicators as controls. (This is the same basic set-up I used in a paper assessing the impact of the Obama ground game in 2008.)
Interestingly, as in other recent elections, the Democrats simply had more field offices than the Republicans did. Udall had 32 offices statewide; Gardner had 12. That doesn’t necessarily mean Udall did a better job at GOTV; offices can be run very differently across campaigns, and it’s not obvious that more offices means a more effective turnout effort.
Nonetheless, the regression equation actually found no effect of the field offices at all, for either campaign. I tried several different specifications of the field office variables and never found one with a coefficient that approached statistical significance. The coefficients are plausible—roughly a point or two in the Republican direction for counties that had Gardner field offices, and maybe half a point in the Democratic direction for counties that had Udall field offices—but the standard errors are so large that we can’t be confident that these results are real.
Now, this doesn’t mean that these offices had no effect at all. The test I ran is a fairly rough one, operating at the county level. It’s possible that a more local analysis at the level of the precinct or even the individual household could show some serious and statistically significant effects. It’s also possible that both campaigns ran pretty effective GOTV efforts that canceled each other out. (A lot of their activity was in the same counties.) But at least from this rough test, it’s looking like Gardner won the same way that Republicans won all over the country last year, by benefiting from an anti-Obama wave. GOTV may have helped, but it’s quite plausible we’d have seen the same outcome if Gardner hadn’t waged any GOTV effort at all.


