The margin of error is getting more attention than usual in the news. That’s not saying much since it’s usually a tiny footnote, like those rapidly muttered disclaimers in television advertisements (“Offer not good mumble mumble more than four hours mumble mumble and Canada”). Recent headlines proclaim, “Trump Leads Bush…” A paragraph or two in, the story will report that in the recent poll Trump got 18 percent and Bush 15 percent. That difference is well within the margin of error, but you have to listen closely to hear that. Most people usually don’t want to know about uncertainty and ambiguity.
What’s bringing uncertainty out of the closet now is the Republican presidential debate. The Fox-CNN-GOP axis decided to split the field of presidential candidates in two based on their showing in the polls. The top 10 were the main event. All other candidates—Jindal, Santorum, Fiorina, et al.—were relegated to the children’s table.
But is Rick Perry’s four percent in a recent poll (419 likely GOP voters) really in a different class than Bobby Jindal’s 25? The margin of error that CNN announced in that survey was a confidence interval of +/- five. Here’s the box score.

Jindal might argue that, with a margin of error of five points, his two percent might actually be as high as seven percent, which would put him in the top tier. He might argue that, but he shouldn’t. Downplaying the margin of error makes a poll result seem more precise than it really is, but using that one-interval-fits-all number of five points understates the precision. That’s because the margin of error depends on the percent that a candidate gets. The confidence interval is larger for proportions near 50 percent, smaller for proportions at the extreme.
Just in case you haven’t taken the basic statistics course, here is the formula.

The p̂ (pronounced “pee hat”) is the proportion of the sample who preferred each candidate. For the candidate who polled 50 percent, the numerator of the fraction under the square root sign will be 0.5 (1-0.5) = .25. That’s much larger than the numerator for the two percent candidate: 0.02 (1-0.02) = .0196. Multiplying by the 1.96, the 50 percent candidate’s margin of error with a sample of 419 is +/- 4.8. That’s the figure that CNN reported. But plug in Jindal’s two percent, and the result is much less: +/- 1.3. So, there’s a less than one in 20 chance that Jindal’s true proportion of support is more than 3.3 percent.*
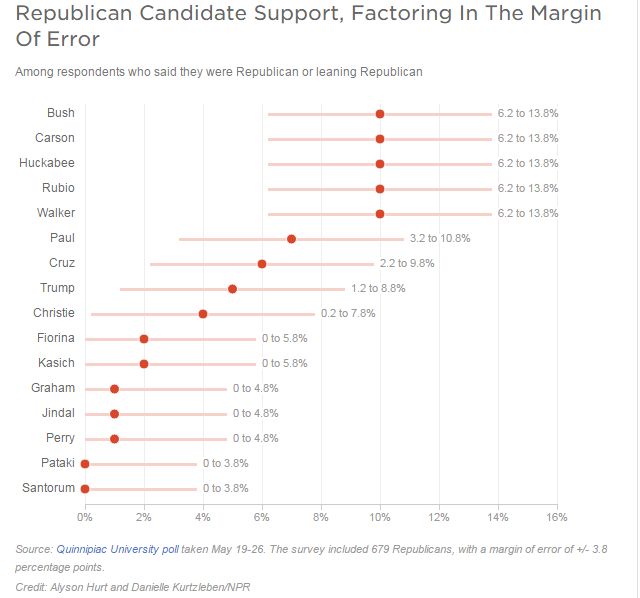
Polls usually report their margin of error based on the 50 percent maximum. The media reporting the results then use the one-margin-fits-all assumption—even NPR. Here is its story from May 29 with the headline “The Math Problem Behind Ranking the Top 10 GOP Candidates”:
There’s a big problem with winnowing down the field this way: the lowest-rated people included in the debate might not deserve to be there.
The latest GOP presidential poll, from Quinnipiac, shows just how messy polling can be in a field this big. We’ve put together a chart showing how the candidates stack up against each other among Republican and Republican-leaning voters — and how much their margins of error overlap.

The NPR writer, Danielle Kurtzleben, does mention that “margins might be a little smaller at the low end of the spectrum,” but she creates a graph that ignores that reality. The misinterpretation of presidential polls is nothing new. But this time that ignorance determined whether a candidate played to a larger or smaller TV audience.

*There are slightly different formulas for calculating the margin of error for very low percentages. The Agresti-Coull formula gives a confidence interval even if there are zero Yes responses.
This post originally appeared on Sociological Images, a Pacific Standard partner site, as “Margins of Error and the Real Rank of the Republican Primary Candidates.”


