


Just how much was spent on last year’s presidential election? A simple answer is $1.1 billion—that’s how much the Romney and Obama campaigns spent on advertising, staff, volunteer offices, etc., according to numbers compiled by OpenSecrets.org.
But that figure is likely massively misleading. For an excellent and detailed explanation as to why, I strongly encourage you to read political scientist Michael Franz’s new piece “Bought and Sold: The High Price of the Permanent Campaign” in The American Interest. But I’ll try to convey some thoughts here about the challenges we face in measuring spending in presidential campaigns and how we attempt to figure out whether $1.1 billion is a lot of money or not.
Probably a better question than “How much was spent?” is “Was 2012 an unusual year for spending?” We can answer that by comparing spending in 2012 to previous years, but one problem with just talking about the raw number of dollars is that it fails to address important changes in the country over time. That is, even if we can adjust the spending levels for inflation, that doesn’t take into account the fact that the nation is wealthier and larger than it used to be, and that the costs for running for office have shifted significantly. For example, television advertising time has gotten more expensive in recent decades, but electronic communications (email, Web ads, social media, etc.) have dramatically shrunk the costs of getting a single piece of advertising in front of a typical voter. It’s also a lot cheaper for a candidate to travel around the country than it was 100 years ago, but they’re expected to do a lot more of that now.
Here is a chart comparing a selection of presidential elections since 1860 based on two different spending measures: dollars spent per vote cast, and dollars spent per thousand dollars of gross domestic product (inspired by this post from Dave Gilson). The first measure attempts to compensate for the growing population, the second for the growing wealth of the country:
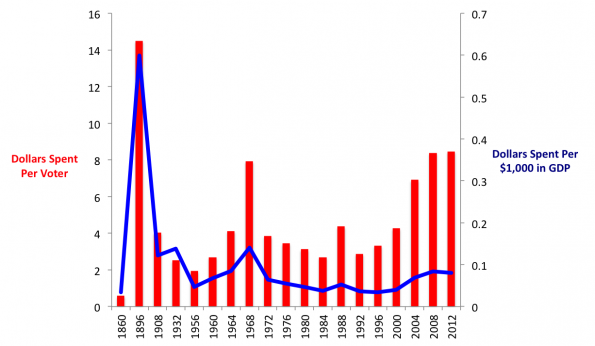
As can be seen, spending in 2012 was basically the same as spending in 2008 by both measures, but both of these elections were relatively pricey compared to those of recent decades; we’ve been on an increase since 2000, when presidential candidates started abandoning the public finance limits set in the early 1970s. Still, note that these elections don’t hold a candle to 1896, when six cents out of every hundred dollars spent in the U.S. went toward a presidential candidate. That election (and 1892, which isn’t depicted here) were about the most expensive in history by many measures. As Franz explains, this was when East Coast Republican financiers devoted huge sums to presidential campaigns to protect their financial interests from what they (correctly) perceived to be a threat from politically agitated Western farmers.
Franz also notes, though, that even these spending figures are inadequate. The dollars-per-voter figure above, for example, doesn’t deal with the fact that the campaigns aren’t really trying for all of the votes that will ultimately turn out. Roughly 28 million votes came out of California, New York, and Texas last year—that’s 22 percent of all the votes that would be cast nationwide—but the presidential campaigns didn’t lift a finger to win those votes from those non-competitive states. Most of the money spent just went to a handful of swing states.
The spending figures above also fail to account for spending by parties, 527s, Super PACs, interest groups, and other organizations devoted to influencing the outcome of the presidential campaign. Some of these figures are knowable; some are simply beyond our ability to track. But all evidence suggests that this spending is on the rise. As Franz writes:
[C]osts are higher because of both supply and demand factors. The supply of cash more readily flows from interest groups (and did for parties in the 1990s) because of lower barriers to entry (that is, less stringent campaign finance laws). At the same time, the demand for cash is higher than ever due to our evenly divided and ever-shifting political landscape.
That is, it’s easier for outside groups to get involved than it used to be, and the national political scene is more competitive than it used to be.
There doesn’t look to be much movement toward tighter regulation of political contributions right now. And the national political environment doesn’t look to be getting any less competitive. (Can we state with any certainty which party will likely control the White House or either chamber of Congress after the next election?) Given that, we can probably expect spending to continue to rise for the foreseeable future. This is not in itself a bad thing! Remember, most campaign spending is just a public information and voter turnout campaign financed voluntarily by the wealthiest Americans, and it doesn’t have nearly the impact on the vote that many claim it does. But if political ads on television annoy you, you might want to take up book reading in 2016.


