The Supreme Court returned to the bench yesterday for the first time since Justice Antonin Scalia’s death last week, and the eight remaining justices appear headed for their first four-to-four ruling, which would leave unresolved a case (Utah v. Strieff) about the validity of incriminating evidence that police acquire during unlawful stops. If the Senate Republicans follow through in denying President Barack Obama’s nominee a confirmation vote for the rest of the year, it would be the first of many such outcomes for the court. Why have so many Senate Republicans—even in swing states, in an election year—lined up for this unprecedented act of obstructionism?
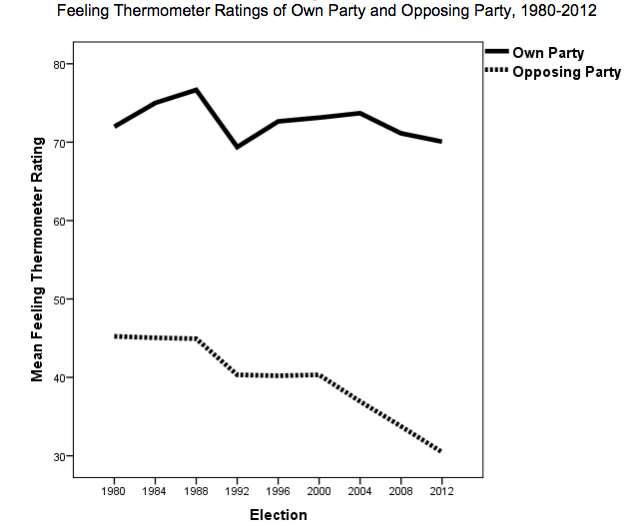
The move exemplifies the Republican Party’s sharp rightward turn—along with the Democratic Party’s less-severe leftward drift—in recent decades. We hear a lot about these trends, though experts are divided about what’s driving them. The deceptively boring chart below, based on surveys of voter attitudes toward each party, explains one important, overlooked characteristic of the shifts:

Since 1980, voters have reported lukewarm feelings toward their own party, as visualized by the thick black line running along the top of the chart (between 70 and 80 degrees on the y-axis’ “temperature” scale). The downward-sloping dotted line tracks voters’ views toward the opposing political party, and shows that our attitudes toward the opposing party are entering a deep freeze. In other words, we like our own party as much as ever, but we’re feeling cold as ice toward the opposition.
The chart is a dispiriting illustration of how exactly we’ve polarized: Not as a result of satisfaction with our own team’s performance, nor because we’ve become much more partisan in our policy preferences, but as a byproduct of our increased hatred for the other team. A 2015 study by two leading political scientists analyzed these decades-long trends in public opinion and identified an increase in what the researchers called “negative partisanship.” It’s the name for how “a growing number of Americans have been voting against the opposing party rather than for their own party,” the authors write (and as the above chart illustrates). So when scores of Republican elected officials and operatives took to Twitter and Facebook within hours of Scalia’s death to declare their opposition to anyone Obama should nominate, they were simply acting on their voters’ knee-jerk disgust with the president’s party, as part of a gradual escalation of partisan hostilities over federal judicial nominations.
Ninety-one percent of the electorate voted straight ticket in 2012—meaning they voted exclusively for candidates of their own party at every level of government. It was the highest such percentage on record. Even as more voters are identifying as politically independent, more are also committing themselves to one party in the voting booth, and their elected officials are behaving in an accordingly partisan fashion. This chart could suggest that the shift is a byproduct of voter’s disgust for the other team more than anything else.


