Since Colorado became the first place in the world to legalize and regulate the recreational use of marijuana, we’ve noticed that weed here has become, well, kind of boring. People don’t think twice about the marijuana shops they pass on their way to work. They hardly notice the pungent aroma of ganja wafting from unmarked warehouses in industrial zones. And at parties or concerts, taking a hit from a vape pen seems almost on par with throwing back a local microbrew.
Will this blasé attitude toward weed ever spread throughout the nation?
Political opinions are not as rigid as cable-news commenters lead us to believe.
In 2012, voters in Colorado and Washington State legalized adult use of marijuana (Washington‘s program, which rolled out this summer, is far less extensive than Colorado’s). Twenty-three states and the District of Columbia already allow for medical marijuana, and recreational-pot measures are on ballots next month in Oregon, Alaska, and Washington, D.C. Even the New York Times has declared that weed should be legal from coast to coast. But when exactly is that likely to occur—could full legalization come in just a few years, or are Colorado and Washington far ahead of the rest of the nation? Or, could these two states be for pot what Nevada is to gambling: islands of tightly regulated use?
Pundits and public polls claim to know what the future holds for marijuana, but there’s another way to determine the answer: data science. Data on similar issues can be used to build a mathematical model that can estimate the likely outcomes for marijuana legalization across the country.
This kind of data-driven approach to answering questions is what powers clever technologies like Google’s search suggestions and Apple’s auto-correct—but doing it well depends on having both good models and good data.
It turns out we do have good models to make predictions about marijuana legislation, since the spread of political policies like this tend to follow predictable patterns. “Policy diffusion is often associated with an S-shaped curve,” says Andrew Karch, political science professor at the University of Minnesota and author of Democratic Laboratories: Policy Diffusion Among the American States. “The initial process of adoption is slow and steady, then the pace picks up, and finally it levels off,” as most states convert. Academics see this pattern because, in general, people’s political opinions are not as rigid as cable-news commenters lead us to believe. The more people that decide a particular stance is reasonable, the more other people feel encouraged to follow suit—political peer pressure, if you will.
Even politicians and officials follow this pattern, Karch says, because it’s easier for them, politically and logistically, to develop and pass legislation if they can piggyback on regulations adopted in other jurisdictions. The result is that these policies seem to gain momentum over time. Eventually, however, this momentum tends to taper off, since there are usually a few holdout jurisdictions that take longer than others to convert, for one reason or another.
Of course, not all policies follow the typical S-shape adoption curve—Amber Alert laws, for example, were adopted nearly simultaneously by all 50 states—but in general, Karch says, “it is a fairly common pattern.”
Sometimes, however, the pattern changes before adoption can reach all 50 states. That’s because either Congress or the Supreme Court intervenes to settle the matter once and for all. So how many states need to weigh in on an issue before we reach the tipping point and get a federal decision? Karch says political science doesn’t have an answer to this question yet, so we dug out the history books.
WE STUDIED A NUMBER of social policies that began spreading on a state-by-state basis before being settled at the federal level. Alcohol prohibition, for example, was passed in 40 percent of the states before the country went dry. And women’s suffrage laws passed in 81 percent of the states before the 19th Amendment enshrined the right in the Constitution. In 1938, when the Fair Labor Standards Act introduced a national minimum wage, 58 percent of states already had such rules on the books. And in 2003, Medicare Part D established senior-citizen drug benefits that were already in place in 54 percent of the states.
The same pattern holds for many major Supreme Court decisions. When the high court overturned mixed-race marriage bans in 1967, 68 percent of the states already allowed for miscegenation. When it decided in Roe v. Wade six years later, 40 percent of the states already permitted abortions under some circumstances. And when the court struck down sodomy laws in 2003, it was following in the footsteps of 72 percent of the states.
We very well may see national marijuana legalization within seven years, in 2021.
The various percentages make it clear that there is no universal tipping point for these policies. But on average, the federal government tends to get involved after about 60 percent of states have moved on an issue. That suggests roughly 30 states will have to legalize marijuana before pot can go national.
We can use these two concepts—that policies often spread according to an S-shape adoption curve, and that after a national tipping point, many of these issues are decided federally—to build a good model for predicting how marijuana legalization will spread and potentially go national. But what about the data? Do we have enough information on recreational marijuana policies to pin down the precise shape of its adoption curve?
THE BAD NEWS IS that having only two states in the legal weed business means the data we do have on hand is pretty sparse. The good news is that we can fill in the blanks by looking at another modern social movement that’s much further along on its likely path toward national adoption: same-sex marriage. Both issues, for example, seem likely to be eventually decided at the federal level. Just as there are legal and financial complications when some couples’ marriages are recognized in some states but not others, a patchwork of states deciding to allow recreational marijuana will create federal headaches when people inevitably transport pot across state lines (just like alcohol did in the pre-Prohibition era of the 1910s).
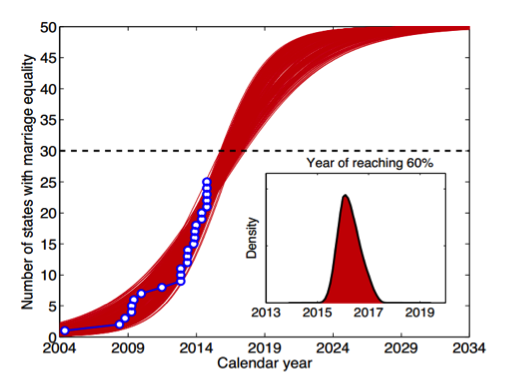
So what does the adoption pattern for same-sex marriage look like? In 2004, Massachusetts became the first state to legalize gay marriage; in the years that followed, 18 states followed suit. The Supreme Court’s recently announced decision to let stand various same-sex court rulings around the country brought the number to 24 and set the stage for it to climb to 30. The resulting data perfectly fits an S-shaped growth model. In the figure below, the blue dots show how the number of states allowing same-sex marriages has increased over time (thanks to University of Colorado-Boulder graduate student Abigail Z. Jacobs for collecting the data). The red lines show the range of adoption curves that best captures the real data, and the dotted line represents the point that these adoption curves hit 60 percent of states—the average national tipping point for state issues like this to be decided federally.

In other words, same-sex marriage is poised to hit the 30-state tipping point. While some people have criticized the Supreme Court’s recent move as a half-measure, arguing that “it kicks the question of same-sex marriage down the road yet again,” nationwide marriage equality does seem to be imminent, and the data suggest it will likely happen in 2016.
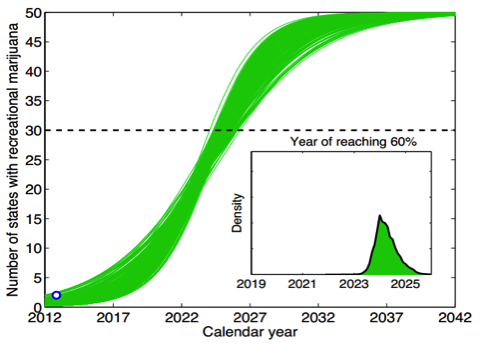
If the marijuana movement follows the same trajectory as same-sex marriage, then these models say that recreational marijuana should hit the 30-state threshold in 2025, or about 13 years after its first electoral victories in Colorado and Washington State.

But there’s reason to believe recreational marijuana may spread even faster than same-sex marriage. For one thing, there are financial incentives for states to legalize weed that don’t come with allowing same-sex marriages. For instance, Colorado is projected to collect 60 to 70 million dollars in recreational pot tax revenue in 2014, plus millions more in licensing fees. Perhaps more importantly, there’s the issue of public opinion. In July 2004, two months after Massachusetts allowed same-sex marriage, a Gallup poll found that just 32 percent of the population agreed gay marriage should be legal. (According to the most recent Gallup poll, 55 percent of Americans now support marriage equality.) When Colorado and Washington State legalized marijuana in 2012, Gallup found that 48 percent of Americans agreed with the move. In other words, at the moment of its first state-level victory, the marijuana legalization movement was 1.5 times more popular than the same-sex marriage movement was.
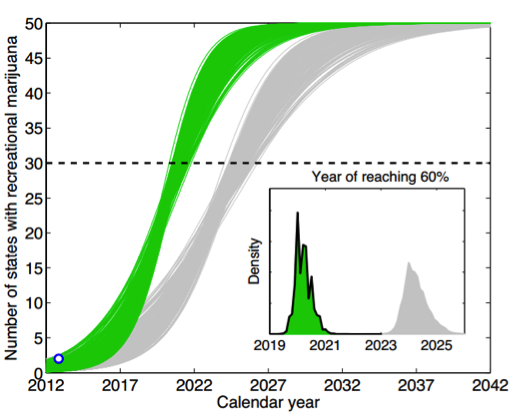
This difference in support could translate into recreational marijuana spreading much faster than same-sex marriage. If marijuana legalization efforts spread 1.5 times faster than same-sex marriage laws, the S-curve models look very different, with legalization reaching the national tipping point much sooner.

Of course, the usual caveats of data science apply to these predictions. As anyone who has spent time in D.C. can attest, the real world of politics is much messier than any model can capture. And, our models don’t say anything about which states will adopt these policies, when they will do so, and who the holdouts will be or why. In reality, same-sex marriage and legal weed could advance more quickly or less quickly than these models predict. The thing about data science, however, is that simple models like these are often remarkably good predictors. Simple models focus more on getting the big picture right, like how many emails you’ll receive in a day, rather than getting distracted by the details, like who will send you your 17th email tomorrow.
So, if recreational marijuana does follow this pattern—and there is little reason to expect otherwise—we very well may see national marijuana legalization within seven years, in 2021. This means that all the new weddings we’ll soon be allowed to throw should prove to be extra festive.


