Unless we radically transform our capitalist system, the working class in the United States faces the likelihood of an ever-worsening future.
By Martin Hart-Landsberg
An employee manages rolls of garment patterns at the American Apparel garment factory on December 14th, 2004, in Los Angeles, California. (Photo: David McNew/Getty Images)
Defenders of capitalism in the United States often choose not to use that term when naming our system, preferring instead the phrase “market system.” Market system sounds so much better, evoking notions of fair and mutually beneficial trades, equality, and so on. The use of that term draws attention away from the actual workings of our system.
In brief, capitalism is a system structured by the private ownership of productive assets and driven by the actions of those who seek to maximize the private profits of the owners. Such an understanding immediately raises questions about how some people and not others come to own productive wealth and the broader social consequences of their pursuit of profit.
Those are important questions because it is increasingly apparent that, while capitalism continues to produce substantial benefits for the largest asset owners, those benefits have increasingly been secured through the promotion of policies — globalization, financialization, privatization of state services, tax cuts, attacks on social programs and unions — that have both lowered overall growth and left large numbers of people barely holding the line, if not actually worse off.
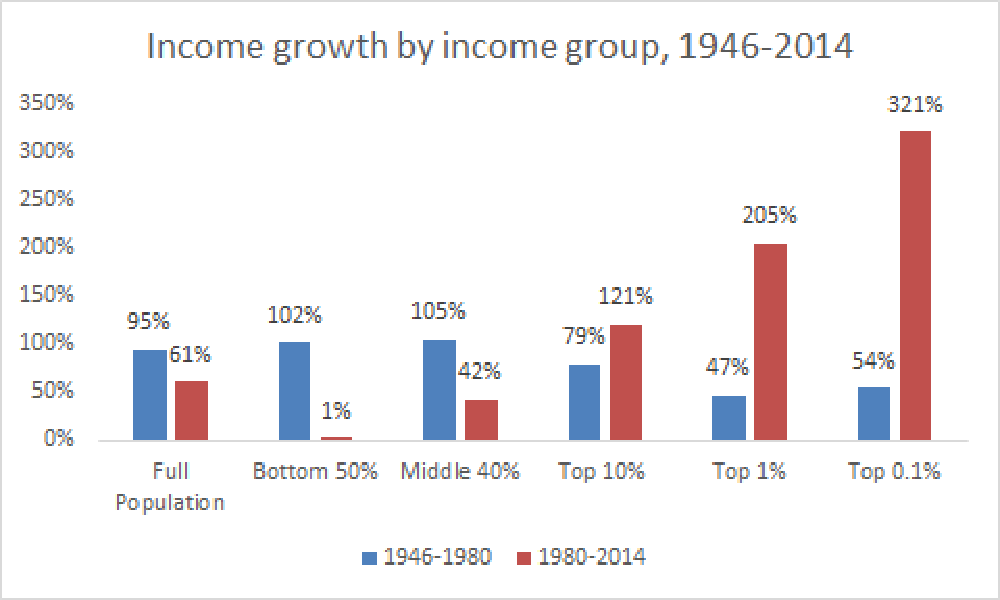
The following two figures come from a Washington Postarticle by Jared Bernstein in which he summarizes the work of Thomas Piketty, Emmanuel Saez, and Gabriel Zucman. The first set of bars shows the significant decline in U.S. pre-tax income growth. In the first period (1946–80), pre-tax income grew by 95 percent. In the second (1980–2014), it grew by only 61 percent.

This figure also shows that this slower pre-tax income growth has not been a problem for those at the top of the income distribution. Those at the top more than compensated for the decline by capturing a far greater share of income growth than in the past. In fact, those in the bottom 50 percent of the population gained almost nothing over the period 1980 to 2014.
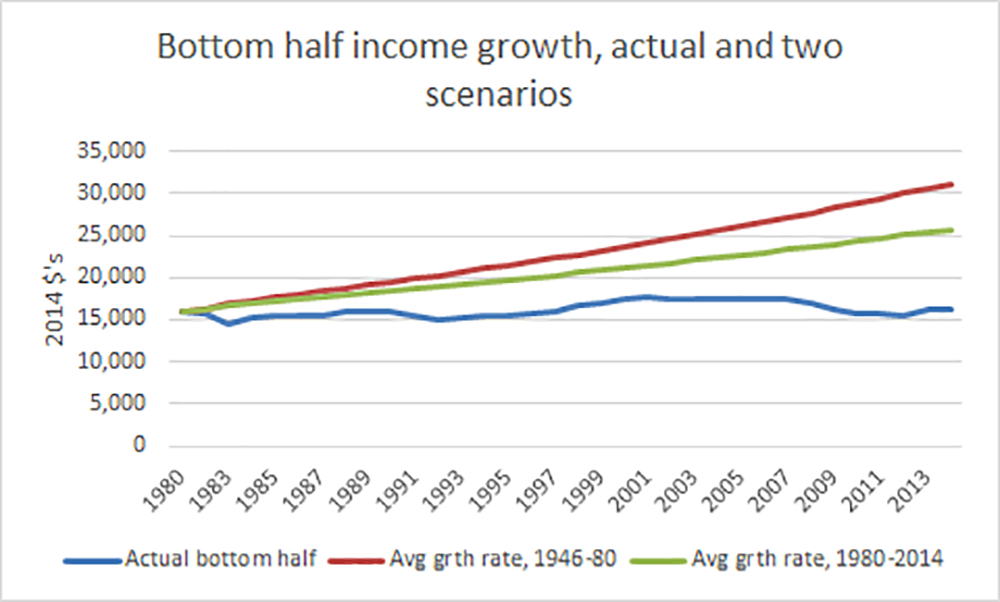
The next figure helps us see that the growth in inequality has been far more damaging to the well-being of the bottom half than the slowdown in overall income growth. As Bernstein explains:
The bottom [blue] line in the next figure shows actual pretax income for adults in the bottom half of the income scale. The top [red] line asks how these folks would have done if their income had grown at the average rate from the earlier, faster-growth period. The middle [green] line asks how they would have done if they experienced the slower, average growth of the post-1980 period.
The difference between the top two lines is the price these bottom-half adults paid because of slower growth. The larger gap between the middle and bottom line shows the price they paid from doing much worse than average, i.e., inequality…. That explains about two-thirds of the difference in endpoints. Slower growth hurt these families’ income gains, but inequality hurt them more.

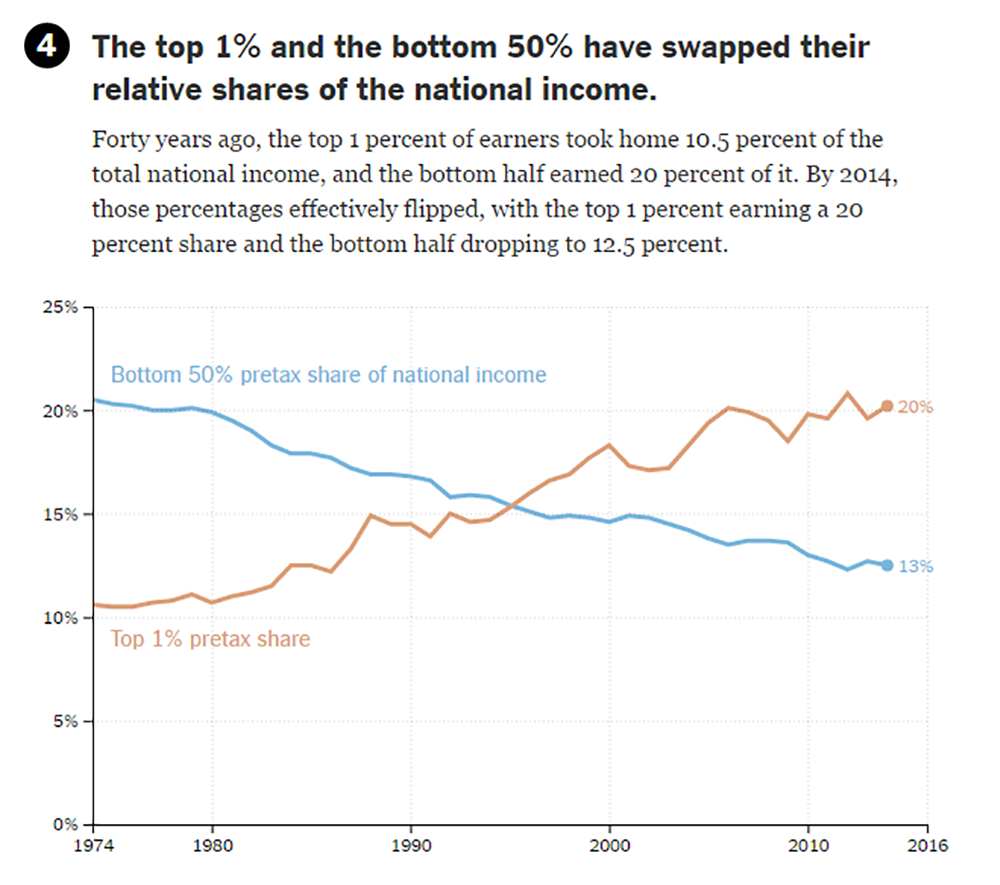
A New York Timesanalysis of pre-tax income distribution over the period 1974 to 2014 reinforces this conclusion about the importance of inequality. As we can see in the figure below, the top 1 percent and bottom 50 percent have basically changed places in terms of their relative shares of national income.

The steady ratcheting down in majority well-being is perhaps best captured by studies designed to estimate the probability of children making more money than their parents, an outcome that was the expectation for many decades and that underpinned the notion of “the American dream.”
Such research is quite challenging, as David Leonhardt explains in a New York Timesarticle, “because it requires tracking individual families over time rather than (as most economic statistics do) taking one-time snapshots of the country.” However, thanks to newly accessible tax records that go back decades, economists have been able to estimate this probability and how it has changed over time.
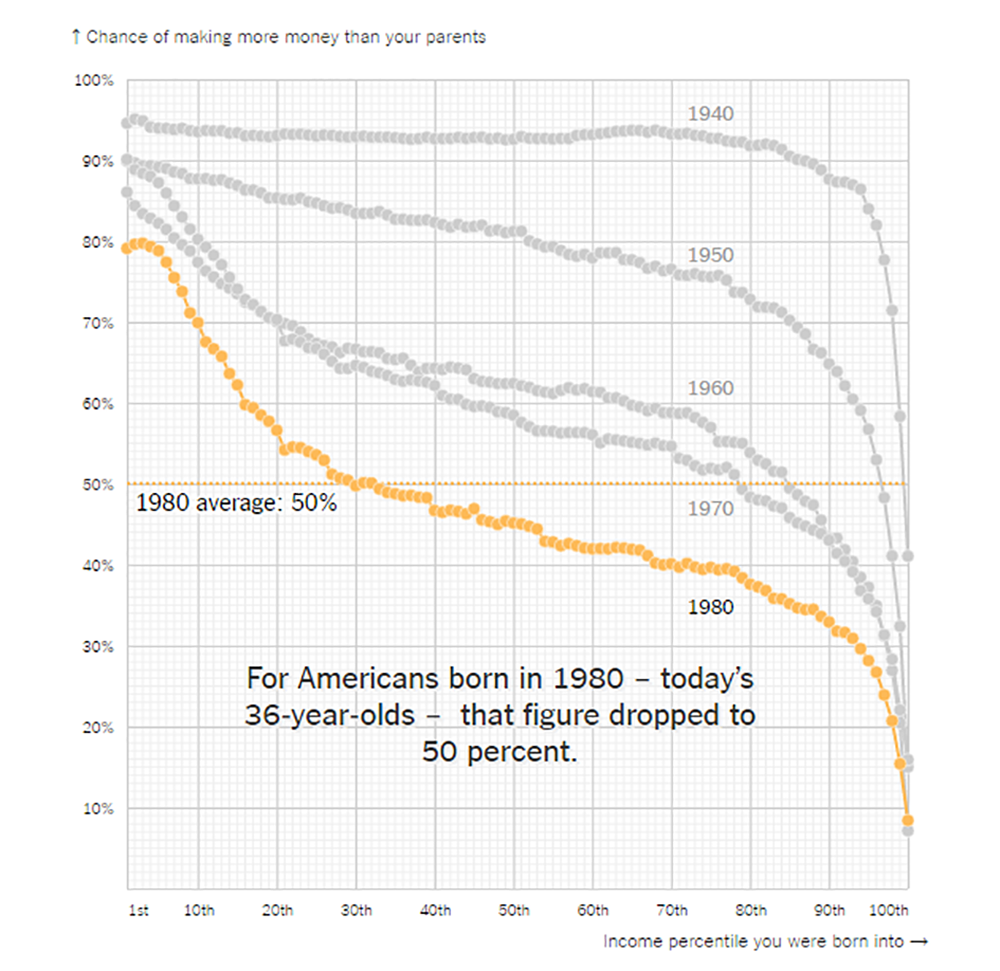
Leonhardt summarizes the work of one of the most important recent studies, that done by economists associated with the Equality of Opportunity Project. In summary terms, those economists found that a child born into the average American household in 1940 had a 92 percent chance of making more than their parents. This falls to 79 percent for a child born in 1950, 62 percent for a child born in 1960, 61 percent for a child born in 1970, and only 50 percent for a child born in 1980.
The figure below provides a more detailed look at the declining fortunes of most Americans. The horizontal access shows the income percentile a child is born into and the vertical access shows the probability of that child earning more than their parents. The drop-off for children born in 1960 and 1970 compared to the earlier decade is significant and is likely the result of the beginning effects of the changes in capitalist economic dynamics that started gathering force in the late 1970s, for example globalization, privatization, tax cuts, union busting, etc. The further drop-off for children born in 1980 speaks to the strengthening and consolidation of those dynamics.

The income trends highlighted in the figures above are clear and significant, and they point to the conclusion that, unless we radically transform our capitalist system, which will require building a movement capable of challenging and overcoming the power of those who own and direct our economic processes, working people in the U.S. face the likelihood of an ever-worsening future.
This story originally appeared on Sociological Images, a Pacific Standard partner site, as “U.S. Working People Hurt More by Rising Income Inequality Than Slow Economic Growth.”


