A year and a half ago, the Census Bureau announced that it would address a long-sought demand of poverty researchers: For the first time in four decades, it would produce a dramatically different and more nuanced calculation identifying who in America struggles to cover basic living expenses and who doesn’t. We wrote at the time that researchers welcomed the promise of a new metric that could finally help quantify the impact of expensive federal anti-poverty programs.
This week, the Census Bureau released its first report on the new Research Supplemental Poverty Measure (so-called because the existing “official” poverty measure will live on, in part due to the political mess of discarding it). The data reveal a slightly counterintuitive picture: More people are living in poverty than thought — by about 2.5 million — but the new measure also shows government anti-poverty programs are making a difference.
“It was Reagan who made the crack about the war on poverty ‘and poverty won,’ and I think to some degree, there is that popular perception,” said Elizabeth Lower-Basch, a senior policy analyst with the Center for Law and Social Policy. “It is in part because the official poverty measure doesn’t capture what are two of the largest anti-poverty programs, particularly for families and children at this point.”

Miller-McCune’s Washington correspondent Emily Badger follows the ideas informing, explaining and influencing government, from the local think tank circuit to academic research that shapes D.C. policy from afar.
These are the Earned Income Tax Credit and the Supplemental Nutrition Assistance Program, or food stamps. The official poverty measure makes no distinction between families who are helped by these programs and those who aren’t.
“I think people get a sense that poverty’s out there, it’s sort of endemic, and public policy can’t really do much to affect it,” Lower-Basch said. “But public policy really does matter. This measure does a better job of reflecting that.”
The official measure — which will still be used to determine eligibility for federal programs — has been largely unchanged for 40 years. When it was first created in the 1960s, the poverty line was set at three times the minimum budget that a family spends feeding itself. Research at the time suggested that this was a good proxy for a family’s expenses. That standard has largely been in place since, with updates for inflation (and to the surprise of its original creator).
Over time, though, food has gotten cheaper, and the average living standard of an American family has risen, while the poverty line has not kept pace. The official measure has also failed to take into account everything from childcare and health costs (on the expense side of the equation) to food stamps and tax credits (on the income side).
The new measure does all of these things, while pegging the poverty line to a different benchmark — just above the 33rd percentile of U.S. family expenses on food, clothing, shelter and utilities — that will shift as living standards do throughout the country. The new measure also weighs the varying cost of living in different parts of the country.
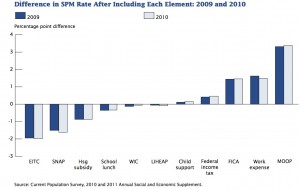
One of the most interesting charts the Census Bureau produced in this week’s report is this one (click to enlarge):

Because the supplemental measure now takes into account a litany of new expenses and benefits, researchers can remove individual pieces from the equation to isolate their impact. This graph illustrates that the Earned Income Tax Credit has the single largest effect on reducing poverty. If the federal government didn’t offer it, the poverty rate would be about two percentage points higher than it is now.
On the other end of the spectrum, medical-out-of-pocket expenses — or MOOP — has the single largest effect on dragging people into poverty. Were it not for these expenses, the poverty rate would be more than three percentage points lower.
One data point the Census Bureau does not provide — and this would be a useful statistic for the future — is the cumulative impact of all of the government’s anti-poverty programs (a calculation that’s more complicated than simply adding up all of the bar graphs to the left).
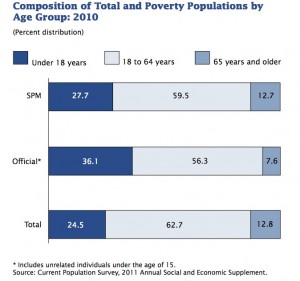
This chart also helps explain one of the other interesting discoveries of the supplemental poverty measure: The number of people living in poverty is larger than the official measure portrays — 49.1 million compared to 46.6 million — but the composition of that population is also slightly different.
As this second graph shows (click to enlarge), there are considerably fewer children and more elderly living in poverty according to the supplement measure.

The supplement measure also shows fewer people living in poverty from several other demographics: Blacks, renters, rural populations, people living in the Midwest and South, and those covered only by public health insurance. Almost every other group — whites, city-dwellers, mortgage holders — now has a higher poverty rate.
In many ways, this is a reflection of the impact of expenses and benefits that have never been considered before. People on Medicaid have minimal co-pays, and so they are less impacted by medical out-of-pocket expenses than elderly who are living only on Social Security checks and who have larger medical costs. The Earned Income Tax Credit, meanwhile, is heavily targeted at families with children, and this chart suggests that program has lifted many children out of poverty.
This also helps explain the discordant revelations that more people are living in poverty than we thought, even as government anti-poverty programs may also be more effective than some people suspected.
“Both of those things are true,” Lower-Basch said. “What [the supplemental measure] tells us is programs help, but there are also real costs that are not reflected in the official poverty measure. Health costs and childcare costs are probably the two biggest pieces of that. And payroll taxes. This does tell you, on the basis of the EITC, that without it people would be taxed into poverty.”
Sign up for the free Miller-McCune.com e-newsletter.
“Like” Miller-McCune on Facebook.
Follow Miller-McCune on Twitter.
Add Miller-McCune.com news to your site.


