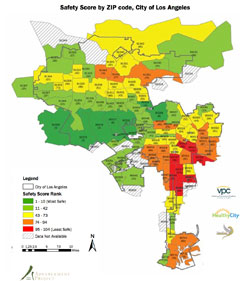
Crime in Los Angeles has been falling for years. The numbers have gotten smaller the last nine years in a row, and in 2010 the city’s murder rate fell to the lowest it has been in four decades.
In celebrating that macro-level trend, though, it’s easy to lose sight that a wide gap still exists between the city’s safest neighborhoods and its roughest ones, where homicide remains the leading cause of premature death for young men. In these neighborhoods, researchers have found that 90 percent of children report having seen or suffered from felony-level violence, and a third have tested at war-zone levels of post-traumatic stress disorder.
Now, Los Angeles’ challenge — and this is true of large cities across the country — is to figure out how to target resources into the individual communities that haven’t fully benefited yet from the nationwide decline in urban crime. A comprehensive new tool from a group of local nonprofit policy advocates and community organizations suggests a way to do that.
The Advancement Project, a public policy group that focuses on inequality, and the Violence Prevention Coalition have created a “community safety scorecard” that assesses the factors that foster or fight violence in every community — from Watts to Hollywood, Koreatown to Century City — within the city of Los Angeles. The strategy — replacing macro statics with fine-grained analysis, weighing risk factors alongside protective ones — could be a blueprint for advocates anywhere who struggle to paint the problems of disadvantaged communities in hard data.
“The goal of this was really to say, if we’re going to try to share best practices, if we’re going to really take what we call a public health approach to violence — seeing violence as a disease — and be very prevention-oriented, then you really need to know what the symptoms are,” said Kaile Shilling, the director for the Violence Prevention Coalition.
The scorecard ranks the 104 ZIP codes in the sprawling, 503-square-mile city, with individual letter grades attached to the level of safety in a given neighborhood (according to crime statistics), the quality of its schools, and a suite of both risk and protective factors. The risk factors include the percent of families in a given ZIP code living in poverty, the unemployment rate, the percent of single-parent households, and the percent of local students scoring below “basic” in English on standardized tests — all factors that can be quantified in hard numbers.

The safety scorecard assesses the factors that foster or fight violence in every community within 104 ZIP codes in the city of Los Angeles.
The protective factors are a little more inventive (although equally quantifiable). They include youth violence prevention nonprofit revenue per capita (as a measure of community resources available to a neighborhood) and active voting population statistics (as a signifier of community engagement).
In blending all of these data points together, the scorecard reveals what many community advocates have long suspected: improvements or declines on one front (say, in school quality) interrelate with others, like safety. There aren’t, in other words, many ZIP codes that get an “A” in schools and an “F” in safety.
“It’s not so much that it’s surprising, but that we’re able to track it, we’re able to say, ‘This actually is true. You think that it’s true, but it really is true,’” Shilling said. “And that’s important to be able to say.
“For us, a lot of it is saying that violence doesn’t exist in a vacuum. You can’t just increase the policing in a neighborhood and make it safe; you need to invest in the schools” — and in the community and family support structures throughout a neighborhood.
The scorecard is primarily powerful to policymakers for these two reasons: it identifies both the most troubled neighborhoods, as well as exactly what they need. Los Angeles Mayor Antonio Villaraigosa has tried to pursue this targeted strategy with the creation of an Office of Gang Reduction and Youth Development that focuses on “GRYD” zones throughout the city. But Los Angeles — and most cities, for that matter — could benefit from even more of this focused attention on challenged areas, where the problems stem from much more than just a lack of police on the street.
“You shouldn’t actually have an equitable distribution of resources across the city, because that’s not where the need is,” Shilling said. “So if we can say — and this scorecard enables us to dig a little deeper — these are the things that are challenging these communities, and this is a ZIP code that’s surrounded by a bunch of ZIP codes that are on the edge, let’s funnel our resources — and sometimes that’s money, sometimes that’s services — into that area.”
Sign up for the free Miller-McCune.com e-newsletter.
“Like” Miller-McCune on Facebook.
Follow Miller-McCune on Twitter.
Add Miller-McCune.com news to your site.


