While President Barack Obama during his run for the White House urged Americans to pay no heed to pundits dividing the country into red states and blue states, a recently released paper demonstrates that when it comes to carbon output there’s a reason for the divide. (A tip of the hat to Grist for alerting us to this.)
The paper — “Carbon Geography: The Political Economy of Congressional Support for Legislation Intended to Mitigate Greenhouse Gas Production,” — by Michael Cragg of the financial consultancy The Brattle Group and Matthew Kahn, professor of economics and public policy at UCLA, parses the geography of per-capita carbon emissions and reveals a national polarization in carbon output and a resulting imbalance in who suffers under any scheme to cut emissions
The differences are fairly stark: While average carbon emissions across the nation per-capita are 7.66 tons, the median — the point where 50 percent of per-capita emissions are higher and 50 percent lower — is 3.28 tons. (The standard deviation is 16.9 tons.)
And what drives that difference? Coal. Five states account for 72 percent of total U.S. coal production and their state carbon emission measures correlate with their coal use and reserves.
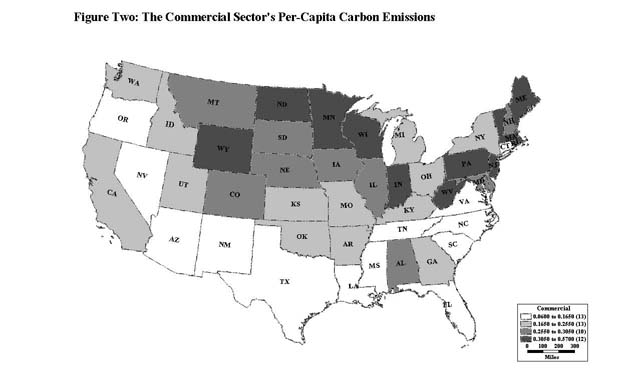
Economic hardships, they note, are likely to ensue from limiting coal production and sales in these rural states with relatively low per-capita income, and that’s going to be a hard sell for any cap-and-trade or carbon tax proposals.
The authors conclude that “any meaningful carbon policy will impose high costs on some and have a smaller impact on others.” Specifically, conservative, poor, rural areas will face a higher carbon bill under a cap-and-trade system than liberal, rich, urban areas.
Interestingly, they note, senators and representatives from the predominantly conservative states with high carbon output have a conservative bent despite their party affiliation and could be the swing votes in any carbon-limiting legislation.
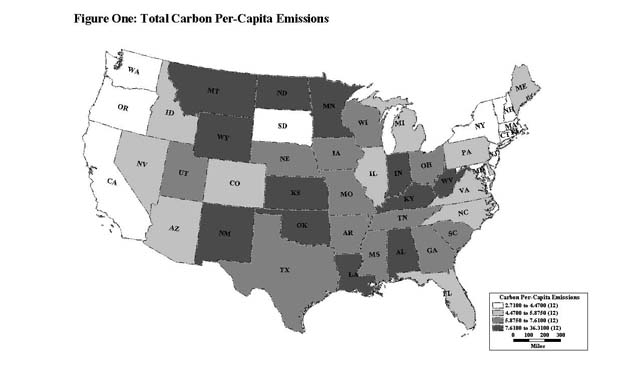
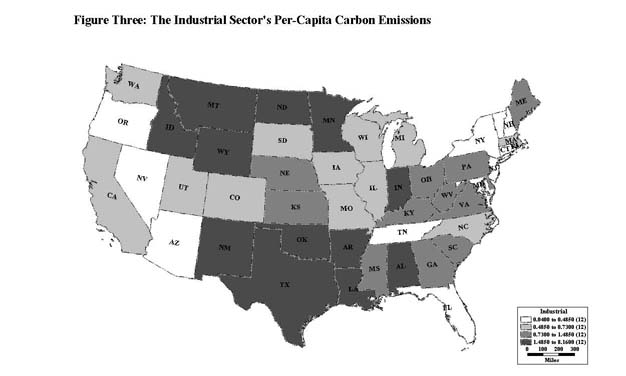
Here are some key geographic points:
• Commercial sector per-capita emissions are high in the Northeast and low in the South, in contrast to the geographic distribution of total per-capita emissions.
• Industrial sector emissions are concentrated around Texas and the highest emissions in the mobile sector around Tennessee.
• Residential emissions are focused in the Northeast and low in much of the Southeast, whereas utility-sector emissions are focused in the Rocky Mountain area and the Midwest.
• The coastal states of California, Oregon and Washington stand out as low-carbon areas because of their proximity to hydroelectric facilities and natural gas.
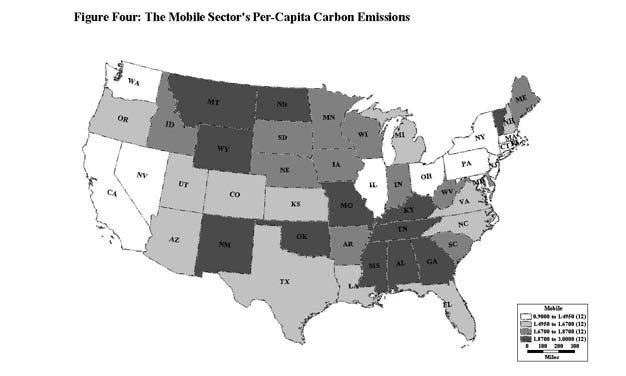
The authors note that this geographic/economic polarization creates a “regressivity” in any energy tax or cost increase, “making it a political necessity that some offset be designed.”
The Waxman-Markey climate and energy bill passed a key House committee today. It relies on a cap-and-trade system for carbon emissions and, contrary to President Obama’s call for auctioning off all permits, early drafts of the bill allow for a giveaway of up to 85 percent of the permits.
Proceeds from auctioning the permits (approximately 15 percent of the total) would go toward some sort of rebate for low- and middle-income families. However, it’s not likely that the funds provided would come close to closing the per-capita carbon gap.
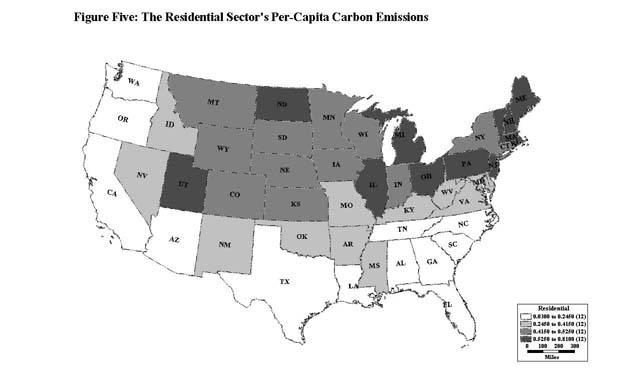
As the paper’s maps illustrate, any carbon-limiting legislation has a tough row to hoe. The latest polarized segment of the population: environmentalists.
Sign up for our free e-newsletter.
Are you on Facebook? Become our fan.
Follow us on Twitter.


