Census-taking is a bureaucratic nightmare. At best, it’s a costly, lengthy, labor-intensive affair. At worst, it’s downright political.
In the United States, thanks to Article I of the Constitution, citizens are counted every 10 years. The 2010 census cost taxpayers $12.9 billion and required 650,000 trained “enumerators,” who fanned out across the country trying to find and count some 300 million of us.
In between decennial censuses, the government conducts the American Community Survey, a long-form questionnaire sent to 3.5 million households annually. You might think filling out a survey to help your government decide how to best spend money on highways, hospitals, and public housing would be a relatively uncontroversial idea. But then, you’d be wrong. Libertarians have long complained that the federal government has no constitutional authority to conduct the ACS—we’re looking at you here, Ron Paul—and balk at the threat of being fined for refusing to participate.
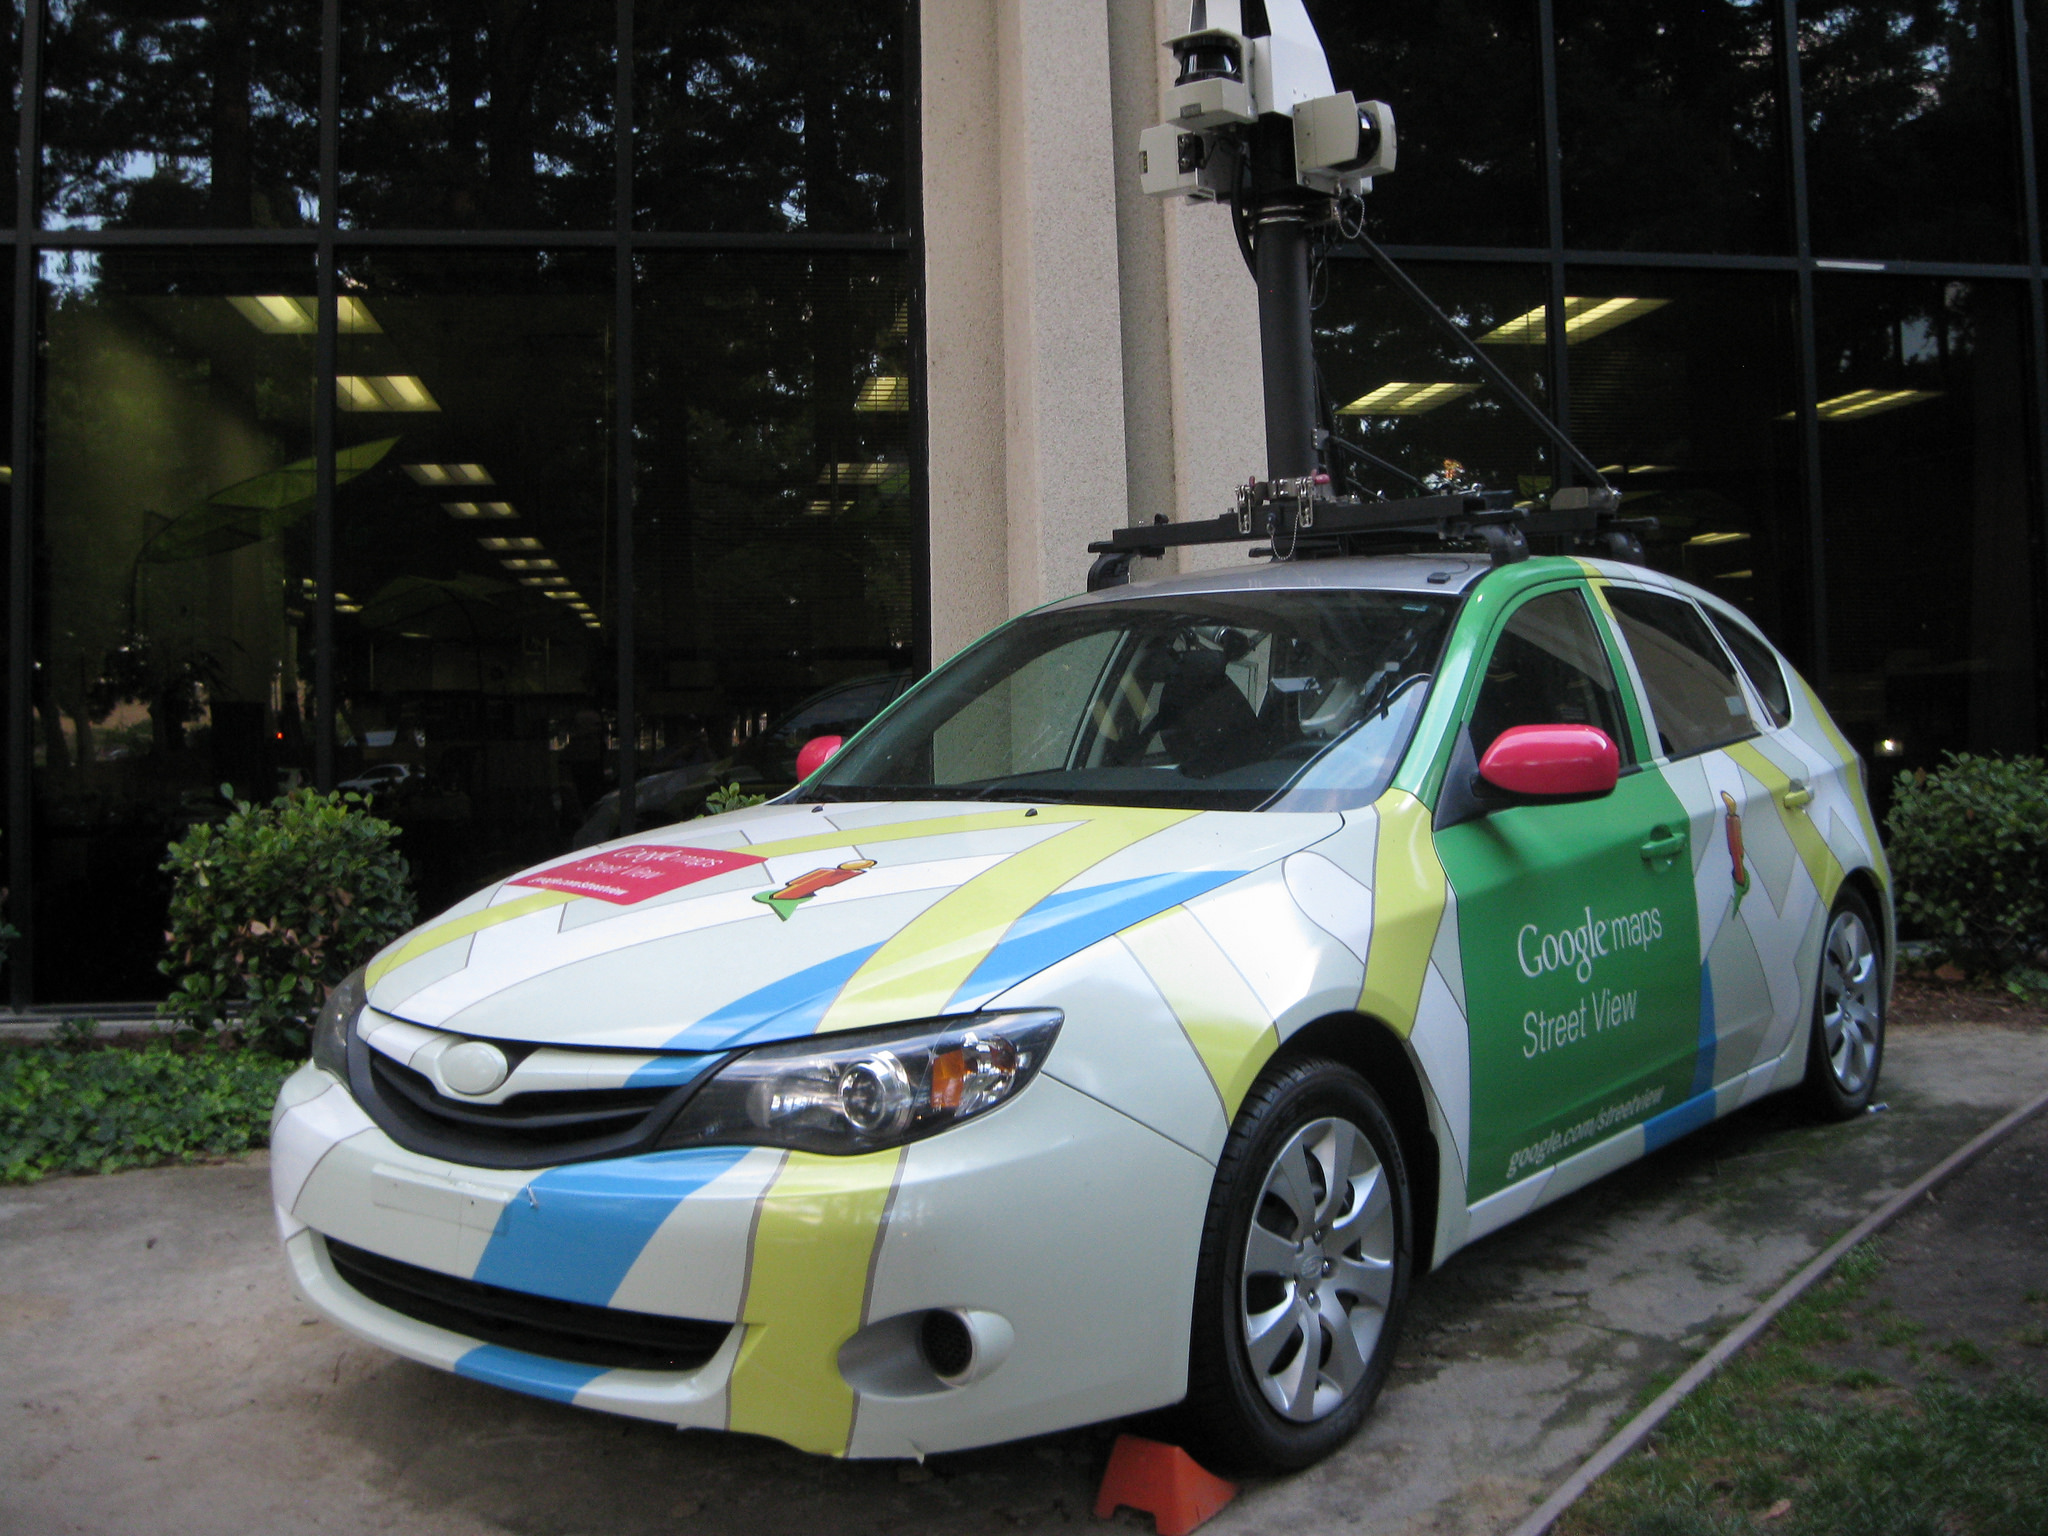
But who needs Big Brother when you’ve got Google Street View? According to a study published recently in the Proceedings of the National Academy of Sciences, publicly available Street View images can be used to make remarkably accurate predictions about a neighborhood, from how its residents vote to the color of their skin—all based on the cars parked there.
The researchers, led by Stanford University’s Timnit Gebru, collected 50 million Street View photos from 200 cities around the U.S. Using deep learning-based computer vision techniques, they were able to identify—with up to 95 percent accuracy—the make, model, body type, and year of the 22 million vehicles that appeared in the images. Such a task would have taken a human expert 15 years to accomplish. A neural network did it in just two weeks, sorting the cars into one of 2,657 fine-grained categories.
Using current ACS data, Gebru and her colleagues then trained a regression model to look for patterns between a neighborhood’s cars and its socioeconomic characteristics and political tendencies. (The scientists trained their model on the subset of counties whose names begin with the letters “A” through “C”; they tested it on counties “D” through “Z.”) The correlations they found were startlingly strong—and a little unnerving.
“The vehicular feature that was most strongly associated with Democratic precincts was sedans,” the authors write, “whereas Republican precincts were most strongly associated with extended-cab pickups. We found that by driving through a city while counting sedans and pickup trucks, it is possible to reliably determine whether the city voted Democratic or Republican: If there are more sedans, it probably voted Democrat (88% chance), and if there are more pickup trucks, it probably voted Republican (82% chance).”

When the researchers compared their precinct-by-precinct predictions with actual results from the 2008 presidential election, their model correctly identified the political leanings of 264 of Milwaukee’s 311 precincts (an accuracy rate of 85 percent) and 87 of Birmingham’s 105 precincts (an 83 percent accuracy rate). In some parts of the country—such as Gilbert, Arizona—the model proved nearly perfect in its predictions.
Beyond politics, the researchers found strong correlations for nearly every demographic and economic characteristic they modeled, including median income; percent of black, Asian, and white residents; and percentage of residents with a graduate degree.
Jonathan Krause, one of the study’s authors, tells Pacific Standard that the research was born out of the promise—and challenge—of computer vision. “Being able to recognize thousands of types of cars with any sort of computer vision algorithm was, at the time, unprecedented, and Google Street View seemed like a remarkable way to obtain that data,” he says. “Once we came up with the AI problem, we began to think about what other things we could do with that data and found ourselves excited by the prospect of predicting demographics.”
As the team looked for correlations between their massive vehicle inventory and real-world ACS data, he says: “We were absolutely surprised. In academia it’s rare to get any sort of correlation that’s that strong. When the first results were coming in we were so surprised that we had to double- and triple-check all of our code to make sure it was real.”
The ACS costs more than $250 million annually, the authors note, and requires a tremendous amount of pencil pushing. A neighborhood’s racial and economic make-up can change seemingly overnight, but there’s often a lag of several years before those changes show up in official government statistics. The idea of using deep learning to analyze massive streams of data—not just Google Street View images but, say, Twitter posts or drone footage—and make predictions about real-world trends is undeniably appealing. It’s not just cheaper than knocking doors and burning shoe leather but faster, too. And while computer models don’t have perfect predictive power, they’re well suited to applications where pretty good is good enough.
Gebru, the study’s lead author, says that she was “excited about applications of our tool, or similar tools, for people studying urban health, pollution levels, education, and political science,” as well as “getting data in countries where the infrastructure and cost to get surveys makes it prohibitive.”
Still, the authors caution, the accelerating pace of artificial intelligence presents real “ethical concerns.” “As today’s AI gets more advanced, the capabilities of those with access to large amounts of data increase,” Krause says. “There is an increasing need to make sure that data is used responsibly.”
We’ve long known that our cars say something about who we are—but perhaps we didn’t realize just how much.


